Food Influencer Marketing: How to Choose Creators Who Drive Grocery Sales
There are food creators who make beautiful content and food creators whose audiences buy groceries based on their recommendations. These are not the same person. Here is how to tell them apart before you spend the budget.
Trusted by leading CPG brands












On this page
▼
- The Difference Between a Food Content Creator and One Who Drives Retail Sales
- The audience cooks from the creator's recipes
- The audience shops at grocery retail
- The creator mentions retail naturally
- The 6 Signals That Predict CPG Grocery Sales Performance
- Signal 1: Saves-to-likes ratio
- Signal 2: Recipe completion rate
- Signal 3: Comment sentiment around purchase and cooking intent
- Signal 4: Organic retailer mentions
- Signal 5: Geographic audience concentration
- Signal 6: Audience income and household type
- The Creator Scorecard: Making Selection a Team Decision
- Why Follower Count Is the Worst Criterion for CPG Campaigns
- Platform-Specific Creator Selection Criteria
- TikTok
- YouTube
- How to Vet Audience Credibility — What Bot Patterns Look Like
- Engagement rate inconsistency by post
- Comment content homogeneity
- Follower account profiles
- Sudden follower count spikes
- Building a Creator Shortlist as a Team Decision
Food influencer marketing for CPG brands is not the same discipline as food influencer marketing for a restaurant, a recipe app, or a DTC meal kit. For brands selling through grocery retail, the only outcome that justifies creator spend is a consumer putting your product in their Kroger cart, their Instacart order, or their Whole Foods basket. A creator who produces visually stunning food content with high engagement but an audience that does not cook from recipes, does not shop at your retail channels, and does not live within a distribution footprint where your product is available is generating awareness with no commercial pathway.
The selection decision is where most food CPG campaigns are won or lost. This guide covers the six signals that distinguish creators who drive grocery sales from creators who drive views, the platform-specific data to pull for each channel, how to vet audience quality before you commit, and a practical scorecard for making creator selection a team decision rather than an individual judgment call.
The Difference Between a Food Content Creator and One Who Drives Retail Sales
Every food creator who goes viral produces content. Not every food creator who goes viral produces grocery sales.
The difference is not about follower count, production quality, or even engagement rate. It is about three specific characteristics that predict commercial behavior in a food creator's audience.
The audience cooks from the creator's recipes
A food creator whose audience actually cooks the dishes they post has an audience that buys ingredients. Viewers who watch food content for entertainment, aspirational lifestyle content, or ASMR responses do not behave the same way at the grocery store. The signal that distinguishes the two is saves. An audience that saves a recipe plans to return to it, which means they plan to cook it, which means they plan to buy the ingredients. Engagement rate measures interest. Save rate measures intent.
The audience shops at grocery retail
A creator whose audience skews toward restaurant dining, food delivery, or meal kit subscriptions is not pre-qualified for a grocery retail campaign regardless of how food-relevant their content is. The audience income level, geographic distribution, and household type determine whether the creator's followers are the same consumers who shop at the retail chains where your product sells.
The creator mentions retail naturally
A food creator who regularly names specific grocery stores in their content ("I found this at Whole Foods," "you can grab this at Kroger") has an audience accustomed to receiving retailer-specific signals and acting on them. A creator who never mentions retailers in their organic content will produce an awkward retailer mention when your brief requires one. Retail naturalness is something you can verify in a creator's archive before briefing.
The 6 Signals That Predict CPG Grocery Sales Performance
These six signals predict grocery sales performance better than any combination of follower count, overall engagement rate, or follower-to-following ratio. Evaluate each creator on all six before any rate discussion begins.
Signal 1: Saves-to-likes ratio
Saves indicate purchase intent. Likes indicate passive approval. For a food CPG brand whose product ends up in a grocery cart, saves are the commercially meaningful signal and likes are not. Calculate saves divided by likes on the creator's recent recipe posts. A ratio above 0.15 (15 saves for every 100 likes) on food content is strong. Creators with high likes and near-zero saves have entertainment audiences, not buyer audiences.
Signal 2: Recipe completion rate
On Instagram Reels and TikTok, completion rate measures the percentage of viewers who watch a video to the end. For food content, completion rate predicts the depth of the viewer's engagement with the recipe. A viewer who watches a 60-second recipe video to completion has absorbed the ingredient list. A viewer who drops off at 8 seconds has seen the hook and moved on. Completion rate is not publicly available on every platform, but creators with a professional media kit will share it. Ask for it specifically. A completion rate above 35% on recipe content indicates an audience with genuine cooking interest.
Signal 3: Comment sentiment around purchase and cooking intent
Read the comments on the creator's last ten posts. Count how many comments include purchase-adjacent language: "I need to find this," "adding to my grocery list," "where did you get this," "made this last night," "my family loved it." These are the signals that tell you an audience is moving from watching to acting. A creator with 400 comments per post composed of emoji responses and "love this" has an audience that appreciates the content. A creator with 80 comments per post where 25 of them reference cooking or buying has an audience that uses the content.
Signal 4: Organic retailer mentions
Search the creator's recent posts for mentions of specific grocery retailers. A creator who regularly says "grabbed this at Trader Joe's" or "found this at Whole Foods" has two commercially relevant qualities: their audience shops at specific grocery stores, and the creator has practice weaving retail callouts into content without it sounding like an ad. A creator who has never mentioned a retailer in organic content will produce a forced-sounding retailer mention when your brief requires one, and the audience will register that it is required rather than natural.
Signal 5: Geographic audience concentration
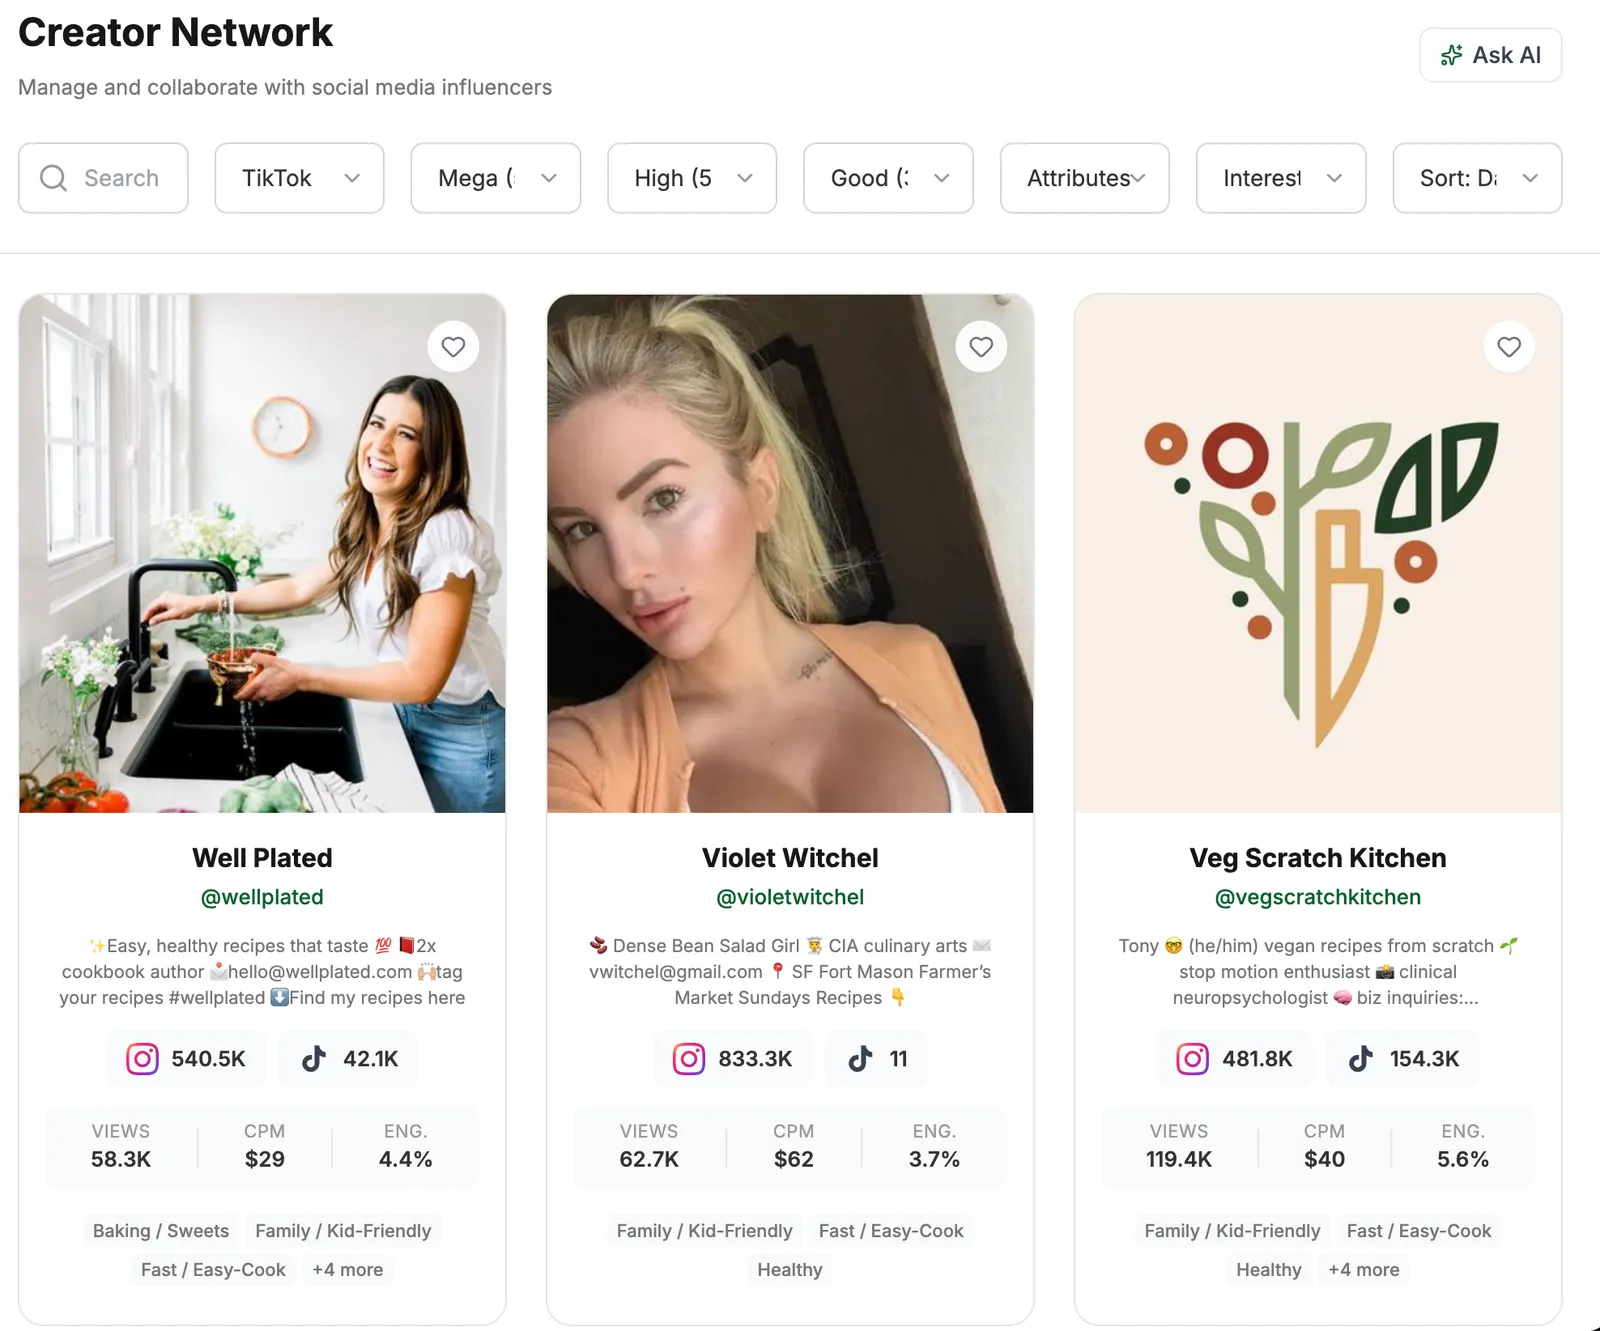
Your product sells in specific stores in specific markets. A creator whose audience is concentrated in markets where your distribution is strong is worth more to your campaign than a creator with the same follower count whose audience is spread evenly across markets where your product does not yet sell. Geographic concentration data is available through third-party audience analysis tools and is surfaced at the creator profile level in Jupiter's creator network. Do not skip this filter. A creator with 80,000 national followers and 60% of their audience in markets where you have no distribution is generating impressions with no purchase pathway.
Signal 6: Audience income and household type
A grocery brand's product has a price point. The creator's audience needs to be able to afford it and to be the household decision-maker who does the grocery shopping. Audience median household income and primary shopper status are available through creator analytics platforms. A specialty olive oil at $18 per bottle requires an audience with discretionary grocery spend. A creator whose audience skews toward college-age consumers in urban apartments is a strong match for a quick-dinner pasta brand and a weak match for that olive oil, regardless of their food content quality.

Jupiter creator profiles surface all six selection signals before you contact a single creator
Credibility scores, retailer proximity data, average views, saves, content interest tags, and geographic audience distribution, across 1,000+ vetted food and recipe creators on Instagram and TikTok.
The Creator Scorecard: Making Selection a Team Decision
Creator selection based on individual judgment produces inconsistent rosters and post-campaign disagreements about why a specific creator underperformed. A scorecard makes the evaluation criteria explicit before selection, applies them consistently across all candidates, and documents the decision logic for future campaigns.
Use this scorecard to evaluate any food creator before booking. Score each signal from 1 to 3, where 1 is below threshold, 2 is at benchmark, and 3 is above benchmark. Prioritize candidates scoring 14 or above. Do not book creators scoring below 10.
Signal | What to Measure | Score 1 (Below threshold) | Score 2 (At benchmark) | Score 3 (Above benchmark) |
|---|---|---|---|---|
Saves-to-likes ratio | Saves ÷ likes on last 10 recipe posts | Below 0.08 | 0.08 – 0.15 | Above 0.15 |
Recipe completion rate | % of viewers watching recipe video to end | Below 20% | 20% – 35% | Above 35% |
Comment sentiment | Purchase/cooking intent comments per post | Fewer than 5 | 5 – 15 | More than 15 |
Organic retailer mentions | Unprompted retailer callouts in recent posts | None in last 30 posts | 1 – 3 in last 30 | Regular pattern |
Geographic audience match | % of audience in your distribution markets | Below 30% | 30% – 60% | Above 60% |
Audience income and type | HHI and primary shopper match for your price point | Poor match | Partial match | Strong match |
A creator with a perfect 18 is rare. A creator scoring 3 on saves-to-likes ratio and comment sentiment but 1 on geographic match may still be worth booking if your campaign objective is national awareness rather than regional velocity. The scorecard makes those trade-offs explicit rather than implicit.
Why Follower Count Is the Worst Criterion for CPG Campaigns
Follower count is the most visible creator metric and the least predictive of grocery sales performance. The reasons are structural, not incidental.
Follower count measures cumulative historical audience accumulation. It includes followers who followed the creator three years ago and have not engaged with their content since, followers who are bots or inactive accounts, followers who followed after a viral post outside the creator's normal content category, and followers who actively see and engage with content. All of these groups count equally in the follower total.
TikTok makes this mismatch most visible. Jupiter's food creator network data shows that mid-tier TikTok creators (50,000 to 250,000 followers) produce median average views of 9,154 per post, while nano creators (1,000 to 10,000 followers) with strong algorithmic distribution can produce average views of 8,000 to 12,000 per post. A nano creator averaging 10,000 views per post has more actual reach than a mid-tier creator averaging 6,000 views per post, regardless of the 10x follower count differential between them.
For CPG brands whose campaign budget is justified by impressions delivered and CPM achieved, selecting on follower count rather than average views means systematically overpaying for reach that does not materialize and underpaying for reach that does.
The replacement criteria for follower count are average views per post (which measures actual reach, not accumulated audience), engagement rate adjusted for tier (which benchmarks quality against peers rather than absolute numbers), and the six signals in the scorecard above. Follower count is useful only as a rough tier classification to organize the market, not as a performance predictor.
Platform-Specific Creator Selection Criteria
The six signals in the scorecard apply across platforms. The specific data points to pull and the benchmarks to use differ by channel.
The primary selection signals are Reels average views (not feed post reach, which is structurally lower), saves per Reel, and audience credibility score. Instagram Reels have a longer algorithmic shelf life than TikTok videos, which means average views is a more stable metric and a more reliable CPM predictor. The save rate signal is strongest on Instagram because Instagram's save mechanic is more visible to users and more integrated into recipe-browsing behavior than TikTok's equivalent. Audience demographics at the creator level, including location distribution and age range, are available through creator analytics platforms and through Jupiter's creator profiles directly.
TikTok
The primary signals are average views per post (not followers), hook completion rate (the percentage of viewers who watch past the first three seconds, which determines whether the algorithm distributes the content beyond the creator's existing audience), and shares. Shares on TikTok food content are a commercial signal: a viewer who shares a recipe video is putting it in front of people they believe will want to cook it. For a brand whose product is featured in that recipe, shares extend the commercial reach of the content beyond the initial distribution. On TikTok, a creator with a strong hook completion rate and high shares on recipe content will consistently outperform a creator with the same followers but lower hook and share performance.
YouTube
YouTube food content operates on a different commercial timeline than Instagram or TikTok. Watch time is the primary signal: a viewer who watches an 8-minute recipe video for 6 minutes has received a full product endorsement, not a passing impression. For food CPG brands, YouTube is most valuable for established pantry products, specialty ingredients with a story to tell, and products that benefit from extended preparation context. Creator selection on YouTube prioritizes average watch time percentage over view count, subscriber count, or comment volume. Note that Jupiter's creator network is Instagram and TikTok only. YouTube creator evaluation requires separate discovery tools.
How to Vet Audience Credibility — What Bot Patterns Look Like
A creator's audience credibility score is the estimated percentage of their followers who are real, active accounts rather than bots, purchased followers, or dormant profiles. For food CPG brands, a credibility score below 70% means more than 30% of the creator's reach is not commercially reachable, and their engagement rate is inflated by non-human activity.
The bot patterns to look for in a manual review:
Engagement rate inconsistency by post
An organic creator's engagement rate fluctuates naturally across posts based on content quality and topic. A creator whose engagement rate is nearly identical across 20 consecutive posts has likely used an engagement pod or purchased engagement to stabilize their metrics.
Comment content homogeneity
Scroll through the comments on three to five posts. If the majority of comments are single-word, emoji-only, or generic phrases like "amazing" and "love this" without any post-specific reference, the comment activity is likely inflated. Genuine food creator audiences leave specific comments: "Made this for dinner," "What brand of pasta is that," "My kids would never eat this but I'm trying it anyway." Generic comments at scale indicate purchased engagement.
Follower account profiles
Click through to 10 to 15 of the creator's recent followers. Accounts with no posts, no profile photo, and followers numbering in single digits are bot accounts. A creator with 40,000 followers should not have a meaningful percentage of their recent follower additions look like this.
Sudden follower count spikes
A creator whose follower growth shows a sudden vertical spike followed by a plateau, visible in third-party analytics tools, purchased followers at the spike date. The purchased followers reduce the effective credibility score and inflate the denominator of every engagement rate calculation.
Jupiter's creator profiles surface credibility scores directly, removing the need for manual vetting across the network. For creators evaluated outside the platform, third-party audience analysis tools generate credibility estimates from follower account quality and engagement pattern analysis.
Evaluating food creators manually across 6 signals takes hours per creator. Jupiter surfaces all of them at the profile level.
Credibility scores, retailer proximity, average views, saves, and geographic audience distribution, across 1,000+ vetted recipe creators, before any rate conversation begins.
Building a Creator Shortlist as a Team Decision
Creator selection made by one person in isolation produces roster decisions that are harder to defend internally and more likely to reflect individual aesthetic preferences over commercial signals. A structured shortlist process makes selection reproducible and stakeholder-aligned.
A practical team shortlist process for a 6 to 10 creator campaign: the marketing lead applies the scorecard to a candidate pool of 20 to 30 creators and eliminates anyone scoring below 10. The remaining pool (typically 10 to 15 creators) is shared with one or two additional stakeholders (a brand manager, a sales lead who knows the retail channel) who review the top scorers and flag any geographic or channel concerns the scorecard did not capture. Final selection is made from the remaining candidates based on a combination of scorecard rank and practical campaign fit (budget alignment, geographic distribution, content angle variety across the roster).
This process takes longer than one person choosing based on creator feel. It produces rosters with better documented selection logic, fewer post-campaign disagreements about why a specific creator was included, and a growing institutional knowledge base of which signals predicted well for your specific brand and retail context.
Jupiter's saved creators feature lets the full team shortlist candidates asynchronously. Team members browse the creator network, save candidates with individual notes, and the shared shortlist builds across the team before the selection meeting. Filtering by content interest, retailer proximity, follower range, and credibility score narrows the candidate pool before the manual scorecard evaluation begins.
For brands building their first creator roster or rebuilding after a campaign that underdelivered, the complete food influencer marketing guide covers the full workflow from brief to measurement. For brands running micro-creator focused programs where the scorecard applies at higher roster volume, the micro-influencer CPG grocery guide covers the selection and management framework in detail. For documented outcomes from campaigns built on these selection principles, see Jupiter's food CPG influencer campaign examples.
Food creator selection built on 6 real signals, not follower count.
Jupiter's creator network surfaces credibility scores, retailer proximity, average views, saves, and geographic audience data across 1,000+ vetted food creators on Instagram and TikTok. Used by 58+ CPG brands including Banza, Pete & Gerry's, and Kettle & Fire.
FAQs
Quick answers to common questions.
What is food influencer marketing for CPG brands?▼
Food influencer marketing for CPG brands is the practice of partnering with social media creators who produce recipe and food lifestyle content to drive product discovery, trial, and grocery purchase intent. For brands selling through retail channels like Whole Foods, Kroger, Sprouts, and Instacart, the goal is not social engagement alone but consumer behavior at the shelf or in the Instacart cart. Effective food influencer marketing selects creators whose audiences are grocery shoppers who cook from recipes, evaluates performance against grocery-specific signals like saves and Instacart add-to-cart rates, and measures success through retail velocity and share-of-voice growth rather than impressions alone.
Where do I find food influencers for my CPG brand?▼
The most efficient sources for food influencer discovery for CPG brands are purpose-built creator networks with food-specific filtering, like Jupiter's 1,000+ vetted recipe creator network with retailer proximity and credibility score data at the creator profile level, Instagram and TikTok native search using food-specific hashtags and content categories, and referrals from previous campaign creators who can recommend peers in their niche. General influencer platforms that do not specialize in food content will surface creators with large followings in food-adjacent categories whose audiences do not cook from recipes and do not shop at grocery retail. Specificity of the creator database is more important than size.
How do I know if a food influencer's audience buys groceries?▼
The signals that indicate an audience buys groceries based on creator recommendations are: a saves-to-likes ratio above 0.15 on recipe content (saves predict purchase intent more than likes), regular purchase and cooking intent language in comments, organic retailer mentions in unprompted content, geographic audience concentration in markets where grocery retail is the primary food shopping channel, and audience household income and household type that matches your product's price point and target shopper. A creator media kit that shows only impressions and engagement rate without save data, comment quality analysis, or audience demographics does not give you enough information to make a commercially sound selection decision.
Is follower count an important criterion for selecting food influencers for CPG campaigns?▼
No. Follower count is the least predictive criterion for grocery sales performance and the most commonly misused one. Follower count measures cumulative historical audience accumulation and includes inactive accounts, bots, and followers from content categories outside the creator's current niche. Average views per post is a more accurate measure of actual reach. Save rate, comment sentiment, geographic audience concentration, and audience credibility score are more predictive of whether the creator's audience will add your product to a grocery cart. For CPG brands whose campaign objective is grocery trial and retail velocity, follower count should be used only as a rough tier classification, never as a performance predictor.
What is a credibility score for a food influencer and why does it matter?▼
A creator credibility score is the estimated percentage of their followers who are real, active accounts rather than bots, purchased followers, or dormant profiles. It matters for food CPG brands because a low credibility score means a significant portion of the creator's apparent reach is commercially non-existent, their engagement rate is inflated by non-human activity, and the CPM implied by their rate is not based on real audience access. A credibility score below 70% is a red flag at any tier. Jupiter surfaces credibility scores at the creator profile level. For creators evaluated outside the platform, third-party audience analysis tools generate credibility estimates from follower account quality and engagement pattern analysis.
What platform is best for food influencer marketing for grocery CPG brands?▼
Instagram delivers 73.7% of impressions from food CPG creator campaigns on Jupiter, making it the stronger impression delivery channel. TikTok accounts for 40.6% of food and beverage brand conversation share, making it the stronger discovery and share-of-voice channel. Most food CPG brands benefit from running creators on both platforms with platform-specific selection criteria: Instagram selection should prioritize saves and Reels average views; TikTok selection should prioritize average views per post, hook completion rate, and shares. Neither platform replaces the other for grocery brands whose audiences are active on both.
More in Creator Selection & Pricing
More from Creator Selection & Pricing.