Marketing Analytics
Influencer Marketing Analytics That Show You What Your Spend Is Actually Doing
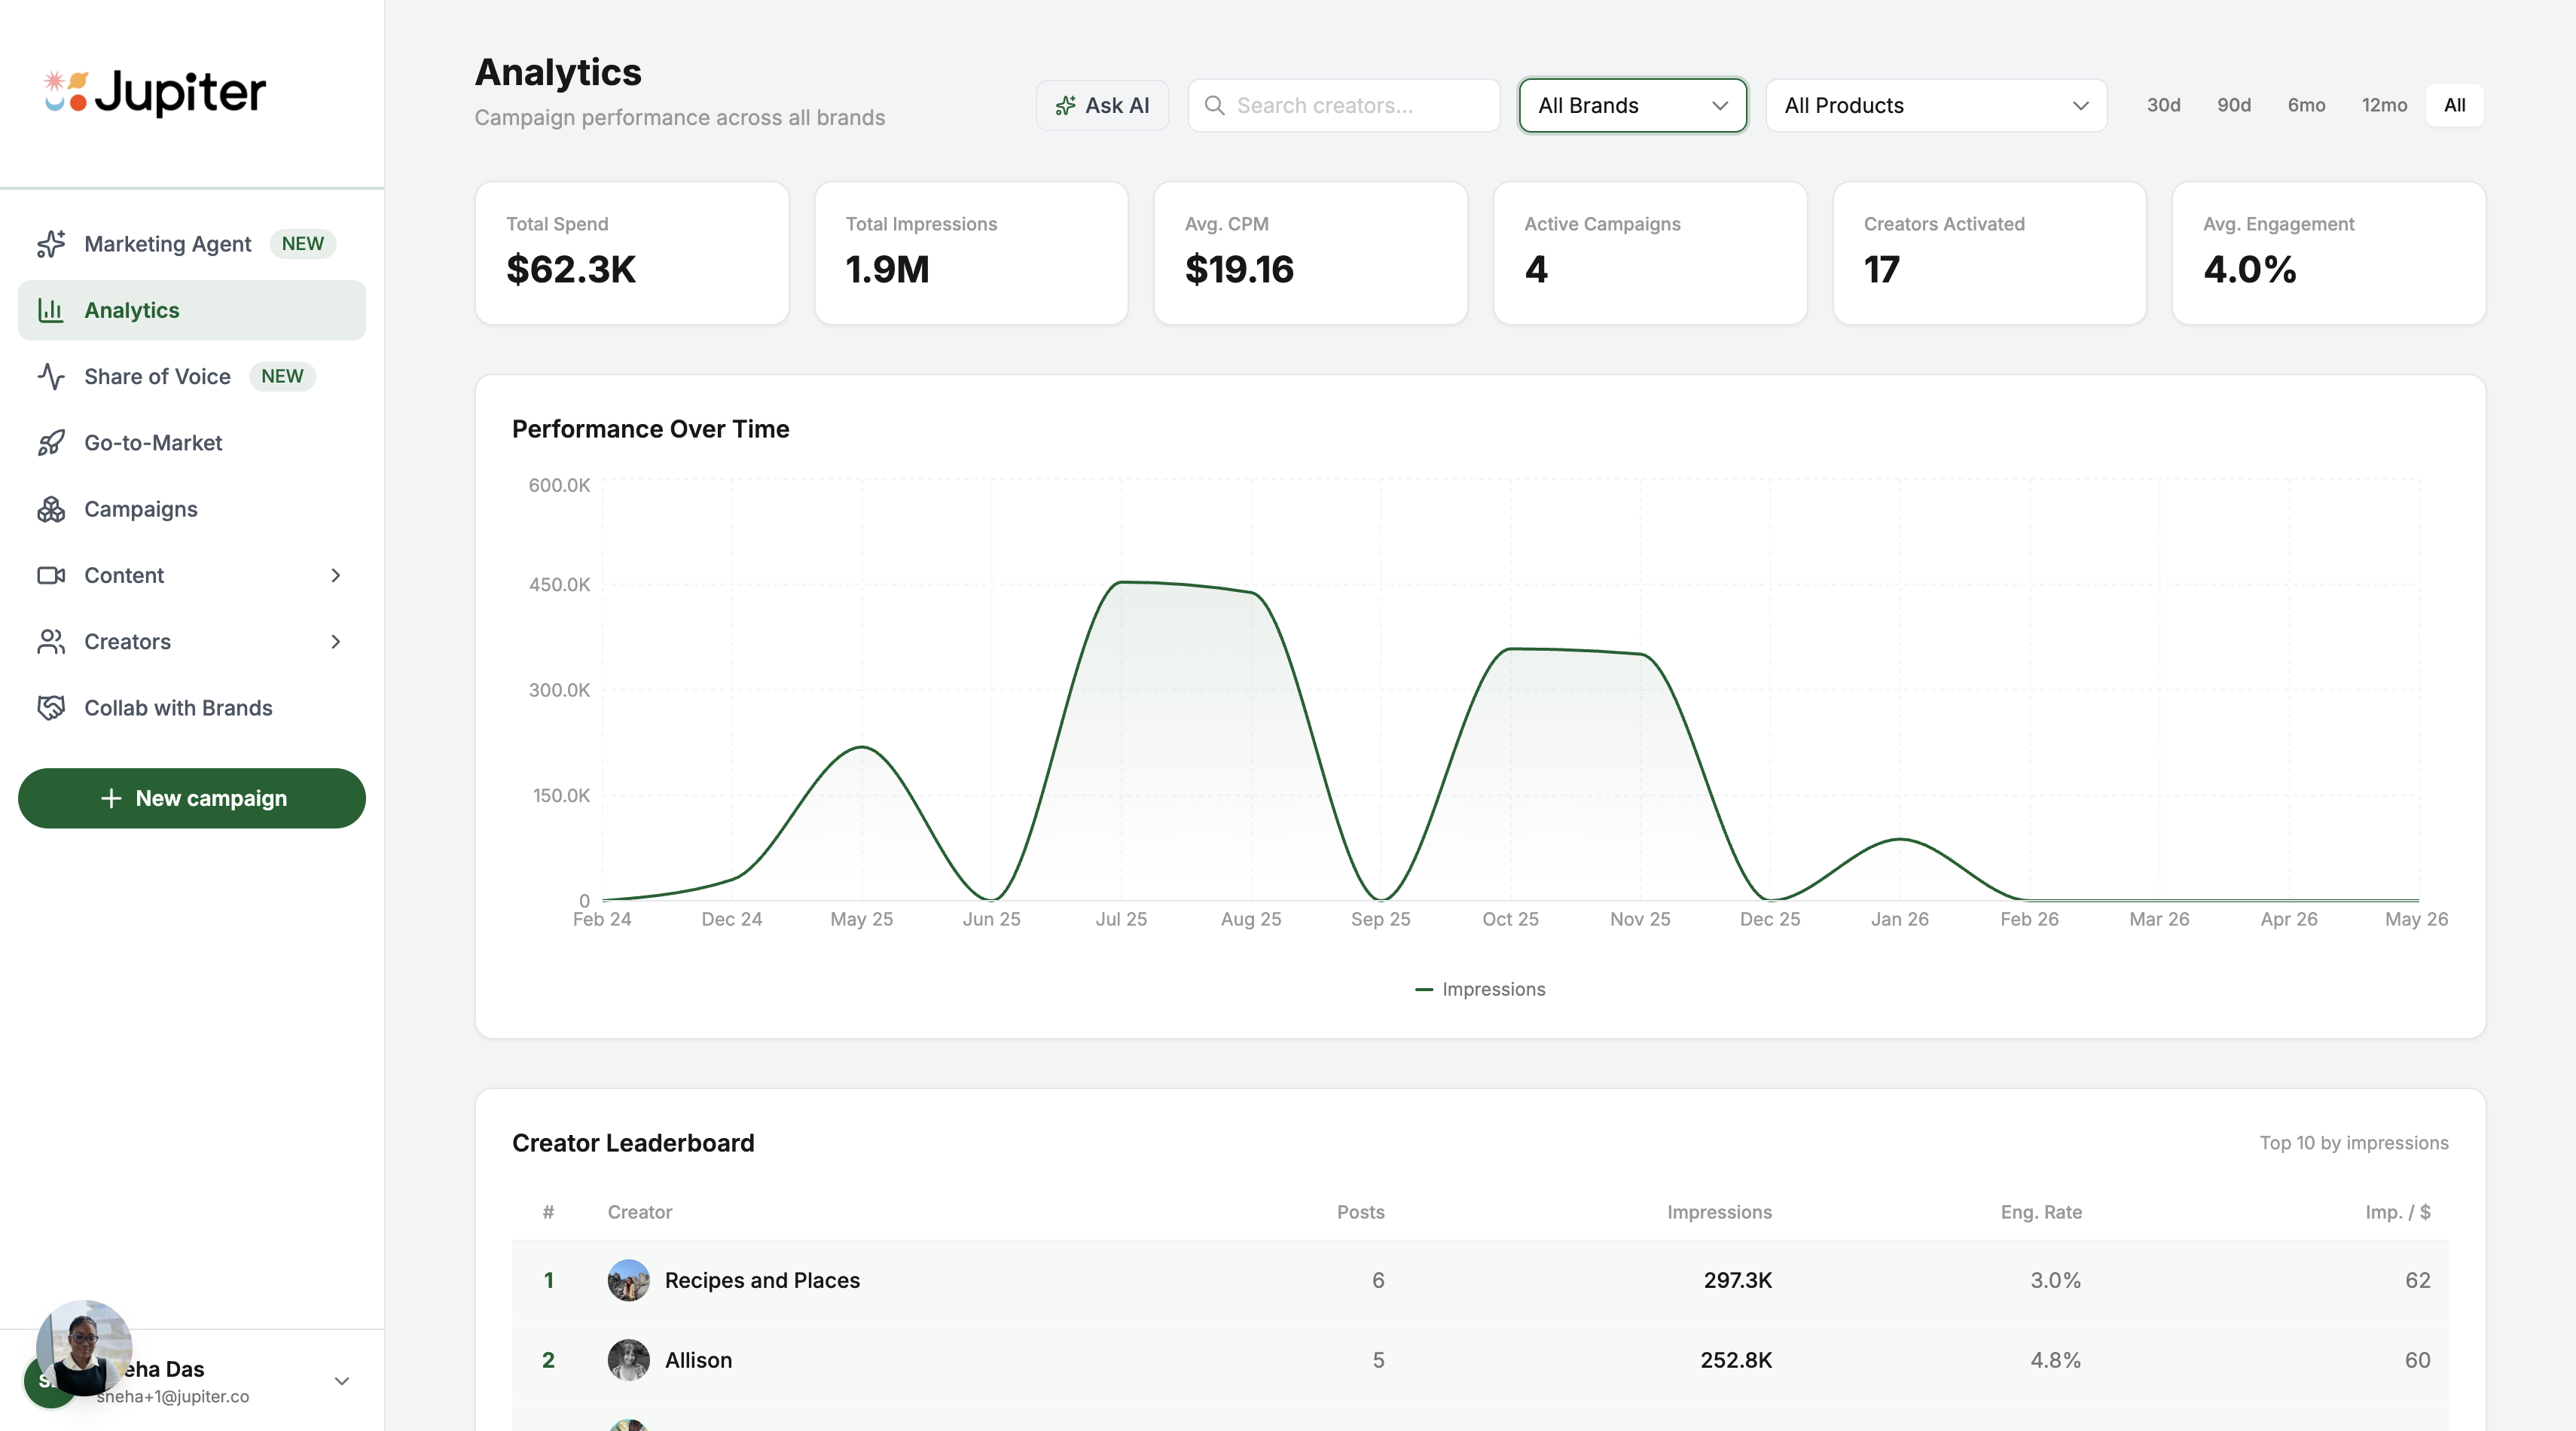
Jupiter's analytics dashboard gives food and beverage CPG brands a real-time view of every campaign, creator, and product — so you can optimize spend, identify your top performers, and prove ROI to leadership.
On this page
▼
- The Analytics Problem Most Food CPG Brands Have
- Six Executive KPIs — Always Current
- Performance Over Time: See the Trend, Not Just the Number
- Creator Leaderboard: Find Your Best Performers
- Product SKU Performance: Know Which Products Win With Creators
- Campaign Health: Catch Issues Before They Become Problems
- Creator Outreach Funnel: See Where You Are Losing Creators
- Filters: Slice Your Data Any Way Your Team Needs
- Date Range
- Brand
- Product
- Creator Search
- Instacart Attribution Analytics
The Analytics Problem Most Food CPG Brands Have
Most influencer marketing analytics live in too many places. A spreadsheet here, a platform export there, a manually assembled monthly report that is already outdated by the time it reaches your CMO. You end up knowing what happened last month, not what is happening today.
Jupiter's analytics dashboard aggregates every campaign, creator, and product into one live view, updated in real time as posts go live and metrics come in.
Six Executive KPIs — Always Current
Jupiter's analytics dashboard leads with six headline numbers that give your team an immediate health check on your entire influencer program:
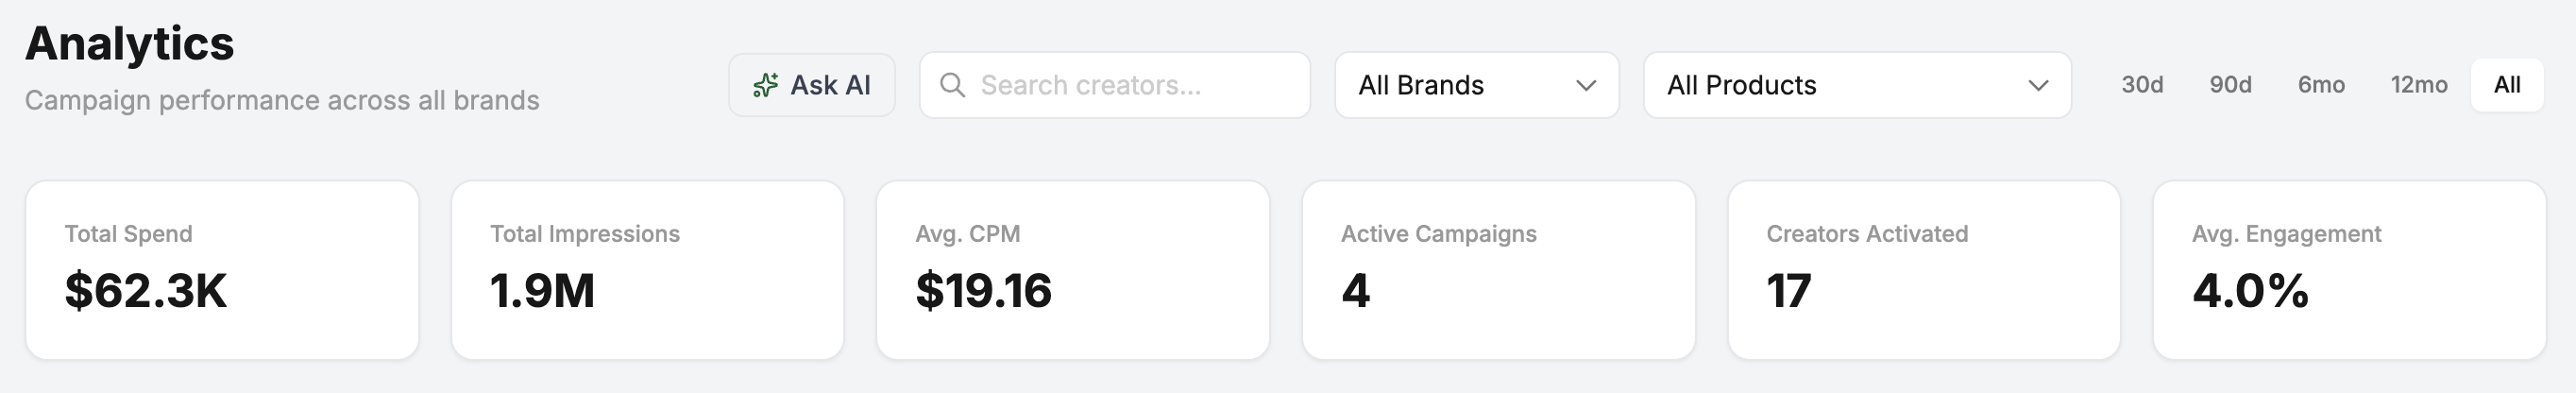
Total Spend: the sum of all creator payments across active campaigns in your selected period
Total Impressions: aggregate reach across all posted content
Average CPM: your blended cost per thousand impressions across all campaigns
Active Campaigns: the number of campaigns currently running
Creators Activated: unique creators who have delivered content in your period
Average Engagement Rate: blended engagement across all posted content
Every KPI shows a delta versus the previous equivalent period. Green for improvement, red for decline. You always know whether your program is improving or deteriorating.
Performance Over Time: See the Trend, Not Just the Number
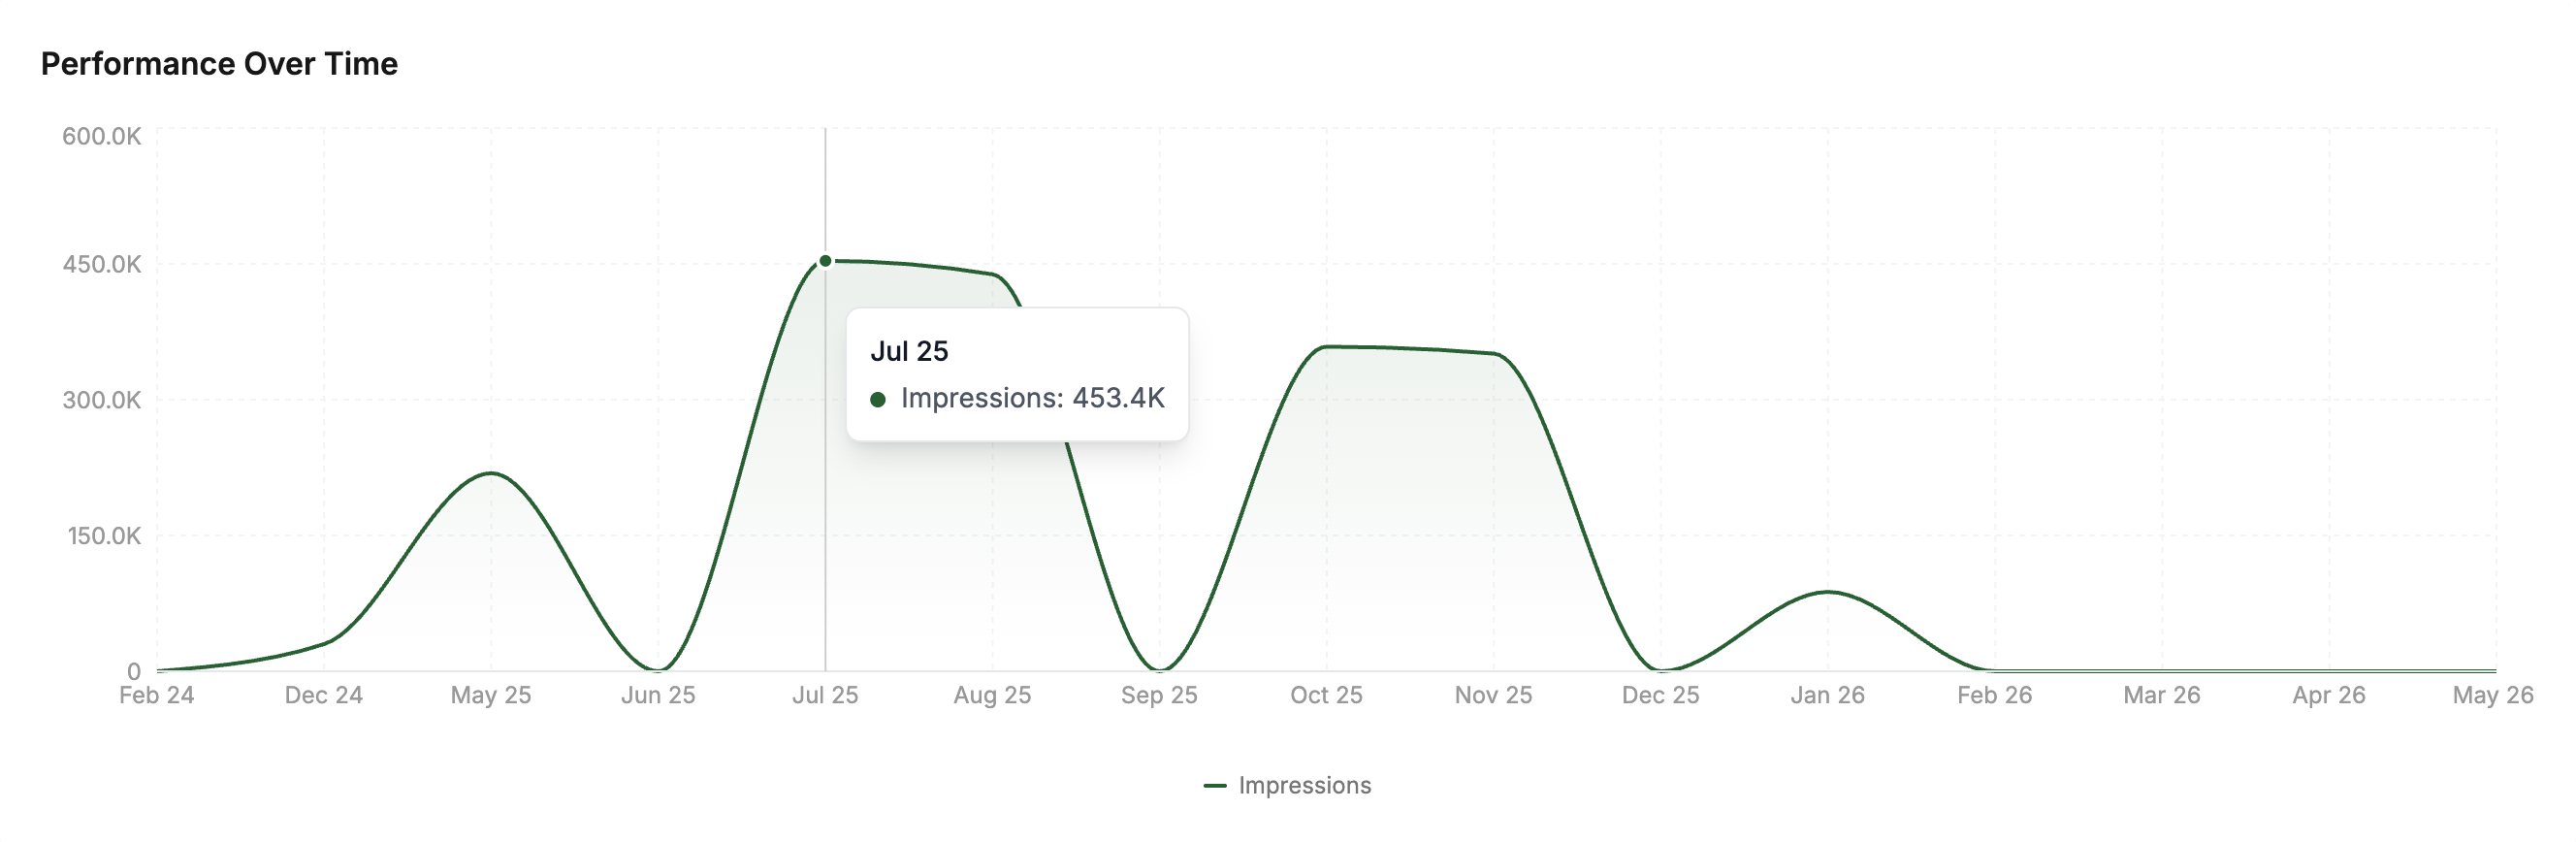
An area chart shows your impression trend over your selected date range, automatically switching between weekly and monthly granularity based on the period you are viewing. See when your influencer content is spiking, when it is flat, and how different campaigns overlap in the timeline.
Creator Leaderboard: Find Your Best Performers
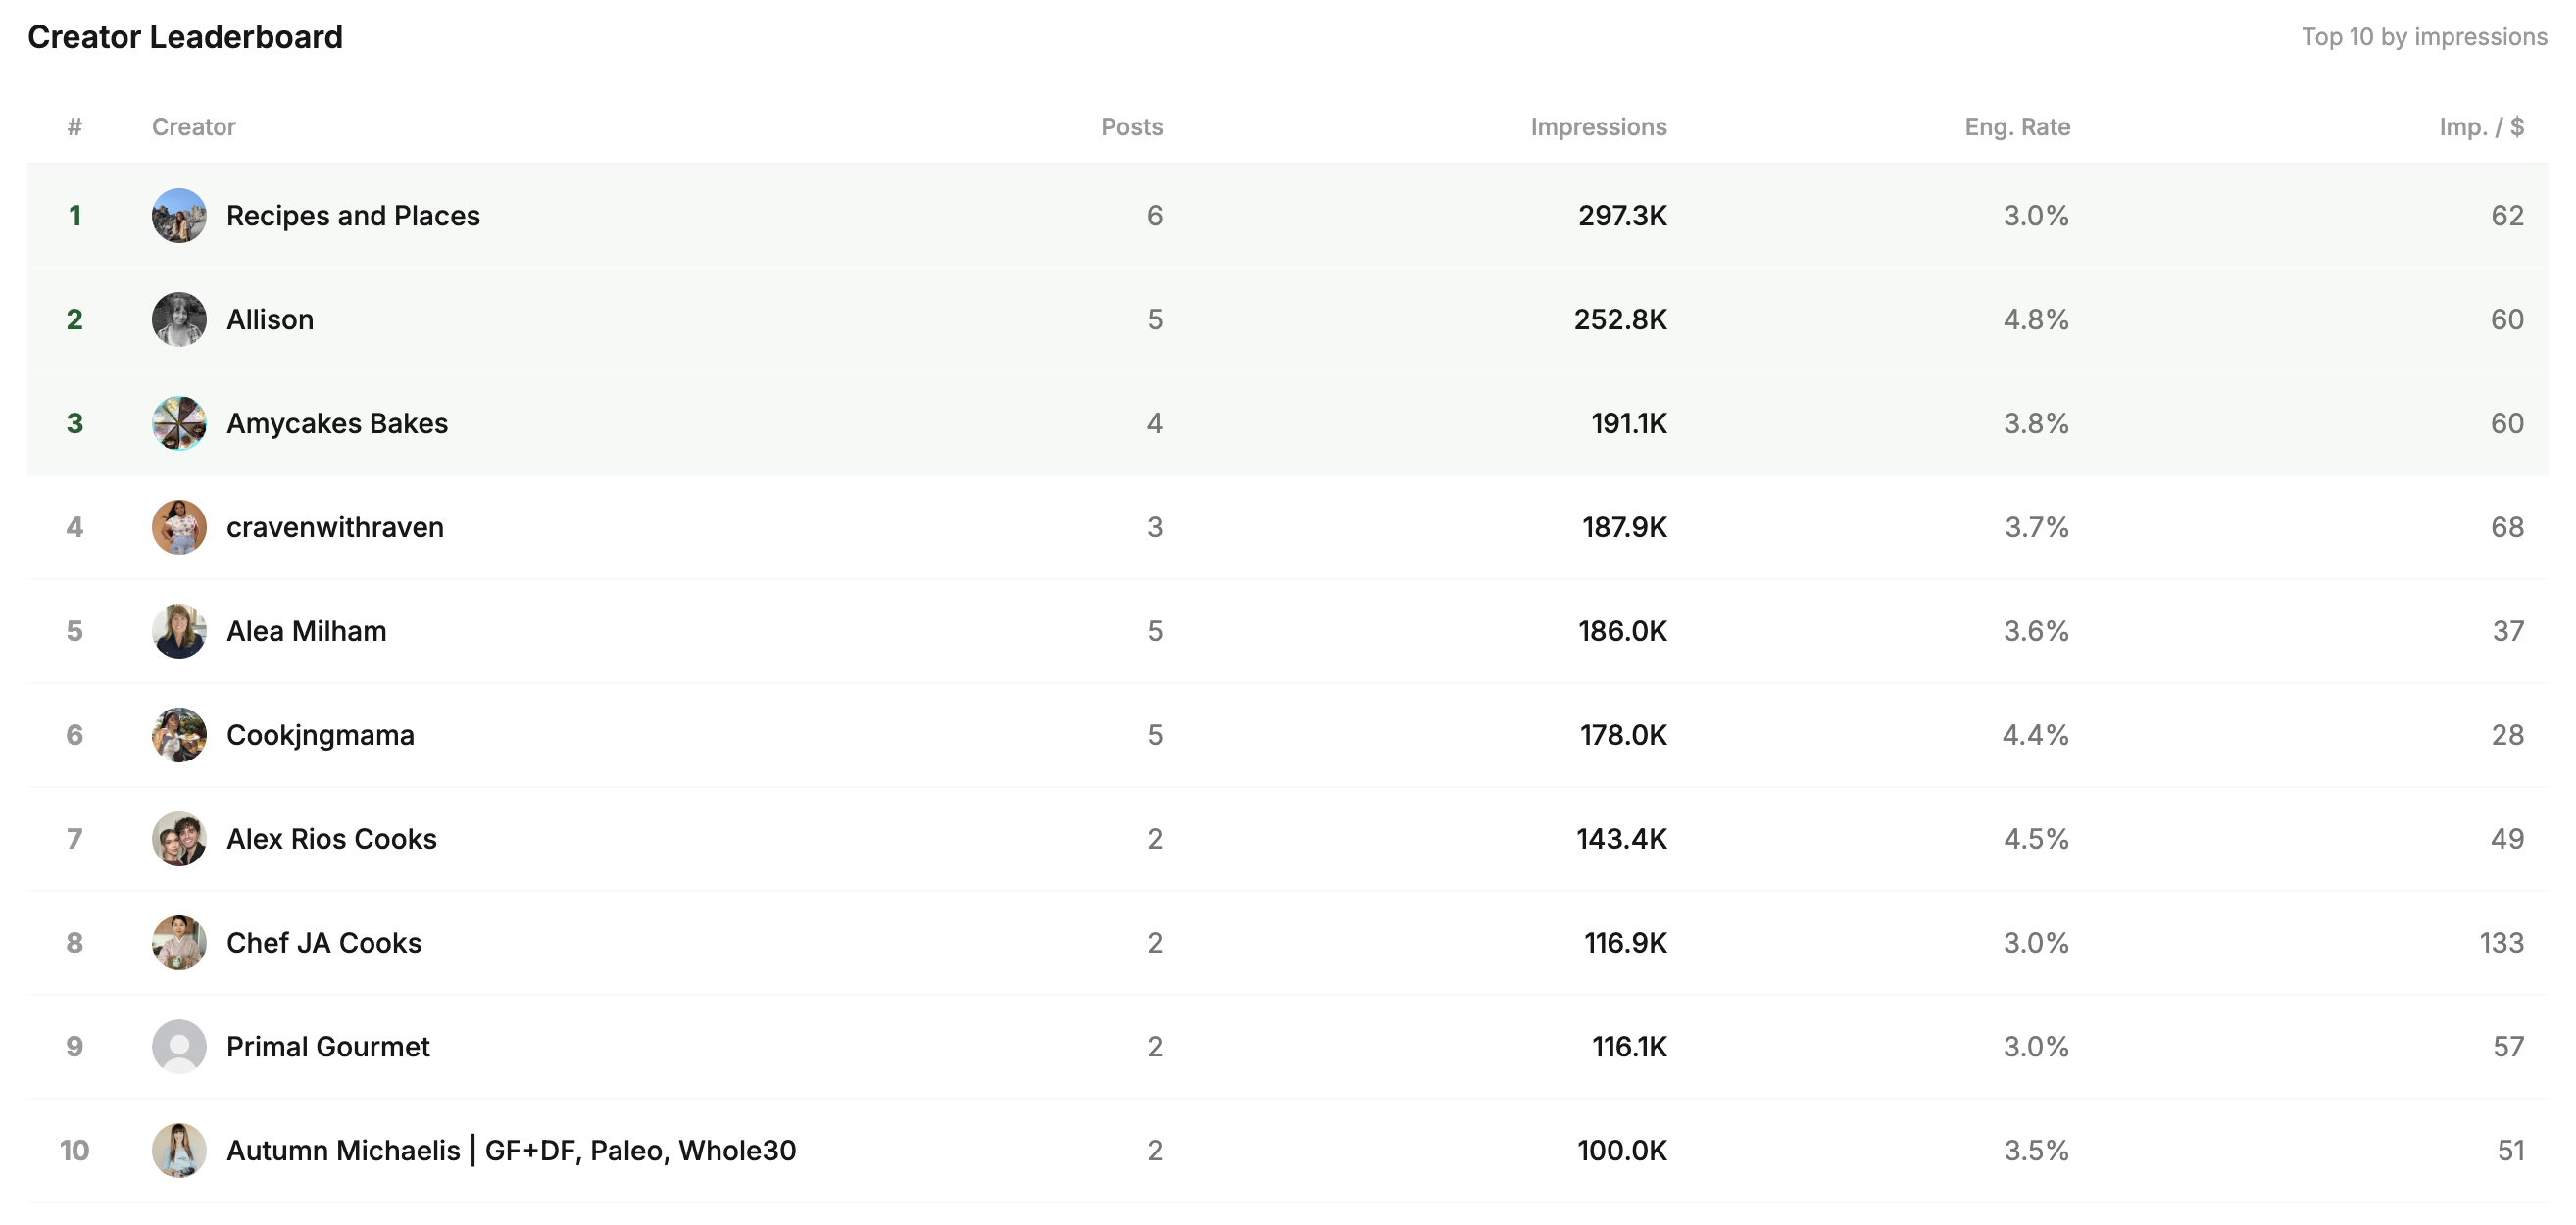
Jupiter ranks your creators by total impressions delivered, with additional columns for posts delivered, average engagement rate, and impressions per dollar. That last metric tells you which creators gave you the most reach for your spend.
The top three creators are highlighted so your team can immediately identify who to prioritize in future campaigns.
Product SKU Performance: Know Which Products Win With Creators
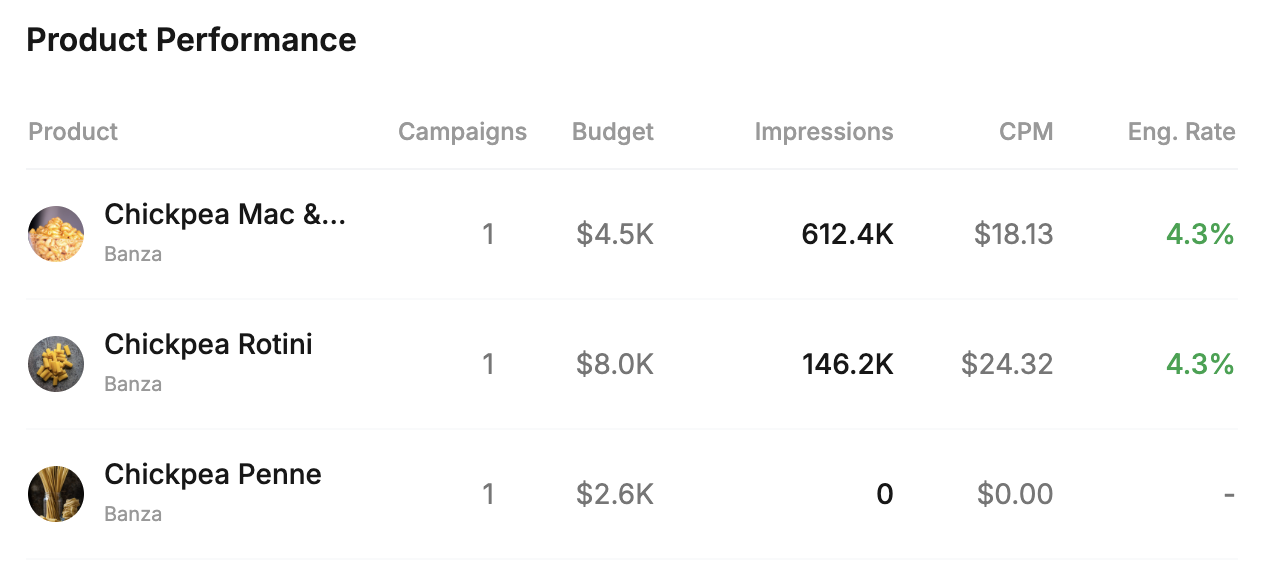
Jupiter's product performance table breaks down influencer results by individual product SKU, showing impressions, CPM, engagement rate, and campaign count per product. For food CPG brands managing multiple SKUs across multiple campaigns, this is the view that connects influencer investment to individual product performance.
Use it to answer: which of our products generates the most creator engagement? Which has the best CPM? Which SKU should we increase influencer spend on next quarter?
Campaign Health: Catch Issues Before They Become Problems
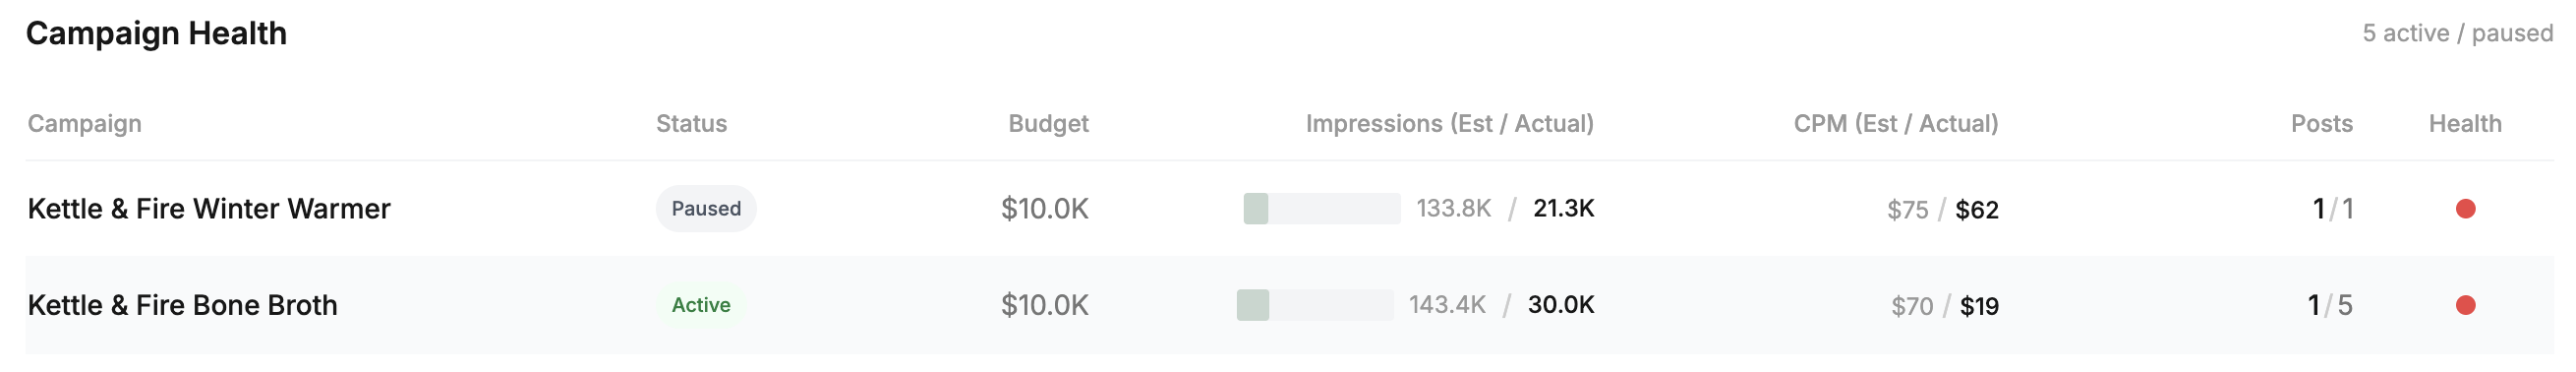
Every active and paused campaign in your account appears in the Campaign Health section with:
Campaign name and current status
Budget spent vs. total budget
Estimated impressions vs. actual impressions (shown as a progress bar)
Estimated CPM vs. actual CPM
Posts delivered vs. posts scheduled
A health indicator: green (on track), yellow (minor variance), red (significant underperformance)
This makes it easy to spot a campaign that is underdelivering and act on it before the window closes.
Creator Outreach Funnel: See Where You Are Losing Creators
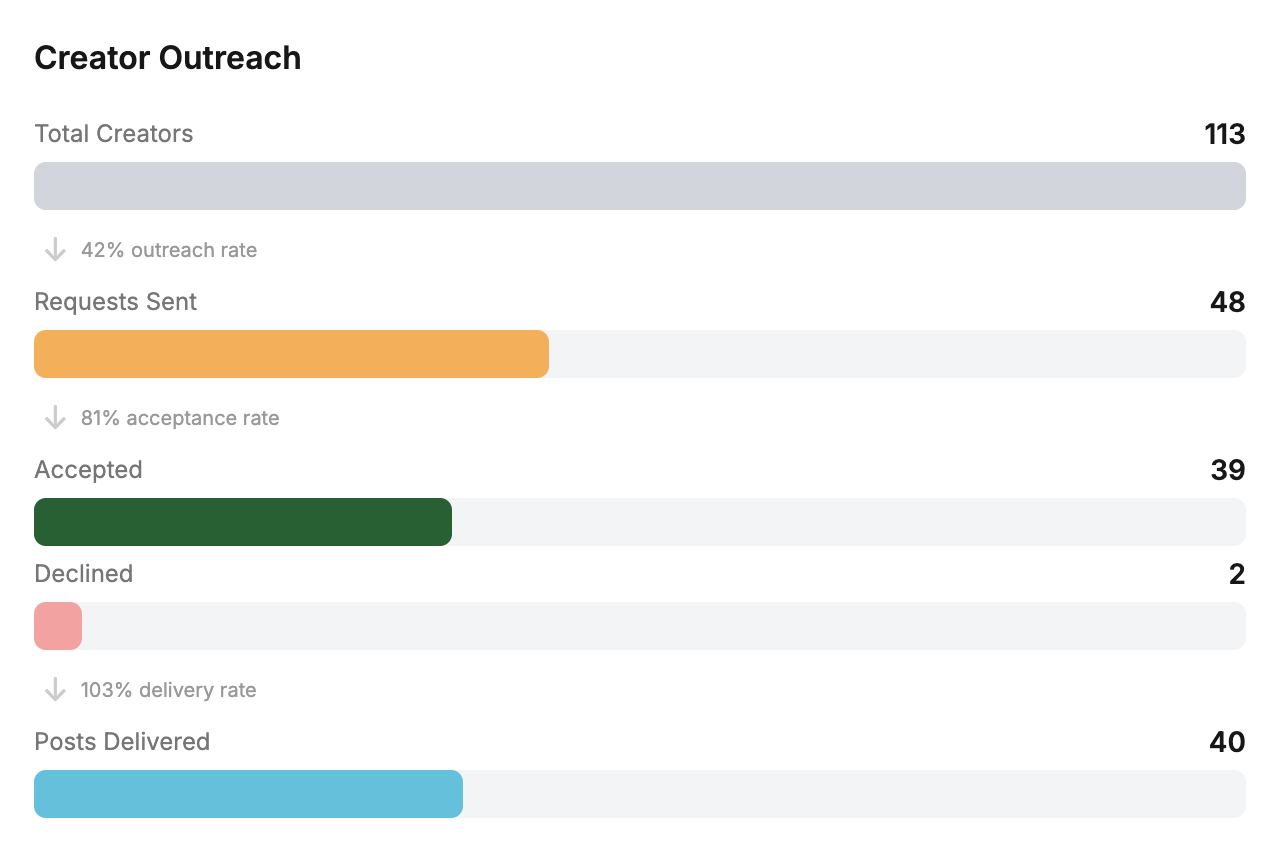
Jupiter shows your full creator conversion funnel: total creators in your network, outreach requests sent, accepted, declined, posts delivered. Each step shows the conversion rate so you can see exactly where in the pipeline you have friction.
A low acceptance rate might mean your offer pricing is below market. A high acceptance rate but low delivery rate might signal brief clarity issues. The funnel makes these patterns visible.
Filters: Slice Your Data Any Way Your Team Needs
Date Range
30 days | 90 days | 6 months | 12 months | All time
Brand
Filter the entire dashboard to a single brand, essential for teams managing multiple food brands within one account.
Product
Drill down to a specific product SKU within your selected brand.
Creator Search
Filter all analytics to a specific creator to see their individual contribution across all campaigns.
Instacart Attribution Analytics
Jupiter's trackable links attribute creator-driven traffic to Instacart and other retail platforms. In your analytics view, see which creators, campaigns, and posts are driving the most purchase-intent clicks through to your grocery retail listings.
Stop Building Influencer Reports Manually
Jupiter's analytics dashboard gives food CPG marketing teams a real-time, self-updating view of everything their influencer program is doing. No spreadsheets. No exports. No outdated reports.
Book a demoFAQs
Quick answers to common questions.
How do you measure influencer marketing ROI?▼
Influencer marketing ROI is measured by comparing the value generated by a campaign, typically measured in impressions, engagement, brand lift, or attributable sales, against the total cost of the campaign including creator fees and platform costs. For food CPG brands, the most meaningful ROI metrics include impressions per dollar, CPM, creator-attributed retail traffic, and product velocity lift during campaign windows. Jupiter provides all of these metrics in a single dashboard.
What is CPM in influencer marketing?▼
CPM stands for cost per thousand impressions. In influencer marketing, CPM is calculated by dividing the creator's fee by the estimated number of impressions their content will generate, multiplied by 1,000. A lower CPM means more reach per dollar spent. Jupiter calculates estimated CPM before a campaign launches based on creator performance history, and tracks actual CPM once posts go live.
What analytics should food CPG brands track for influencer campaigns?▼
Food CPG brands should track total impressions, engagement rate, CPM, spend efficiency (impressions per dollar), per-product SKU performance, creator-attributed retail traffic, campaign health (estimated vs. actual metrics), and creator outreach funnel conversion rates. Jupiter's analytics dashboard provides all of these metrics in one place, filterable by date range, brand, product, and creator.
What is a good engagement rate for food influencer marketing?▼
Engagement rates vary by creator tier and platform. For Instagram, a rate above 3% is generally considered solid for food influencers; above 5% is strong. For TikTok, rates above 5% are typical for food content; above 10% is strong. Micro and nano influencers typically achieve higher engagement rates than macro creators. Jupiter color-codes engagement rate in its analytics: emerald green for high, blue for solid, gray for below average.
How does Jupiter track influencer campaign performance in real time?▼
Jupiter pulls metrics directly from the social platform APIs for Instagram and TikTok for every piece of posted creator content. Performance data updates continuously after a post goes live. Users can also trigger a manual metrics refresh on any individual post to pull the most current numbers. All data flows into the main analytics dashboard automatically.