Influencer Reporting: How CPG Brands Track Campaign Performance
Most influencer reporting dashboards were built for DTC brands with a Shopify checkout. CPG brands sell through grocery retail and Instacart, which means the standard reporting playbook measures the wrong things. Here is what to actually track.

Trusted by leading CPG brands

On this page
▼
- Why standard influencer reporting fails for CPG
- The four metrics CPG influencer reporting should actually cover
- 1. Estimated vs actual impressions and CPM
- 2. Creator-level cost efficiency
- 3. Instacart attribution: trackable links and cart adds
- 4. Share of voice movement
- Building a reporting cadence that actually gets used
- The reporting questions that matter to CPG leadership
- How Jupiter handles influencer reporting for food CPG
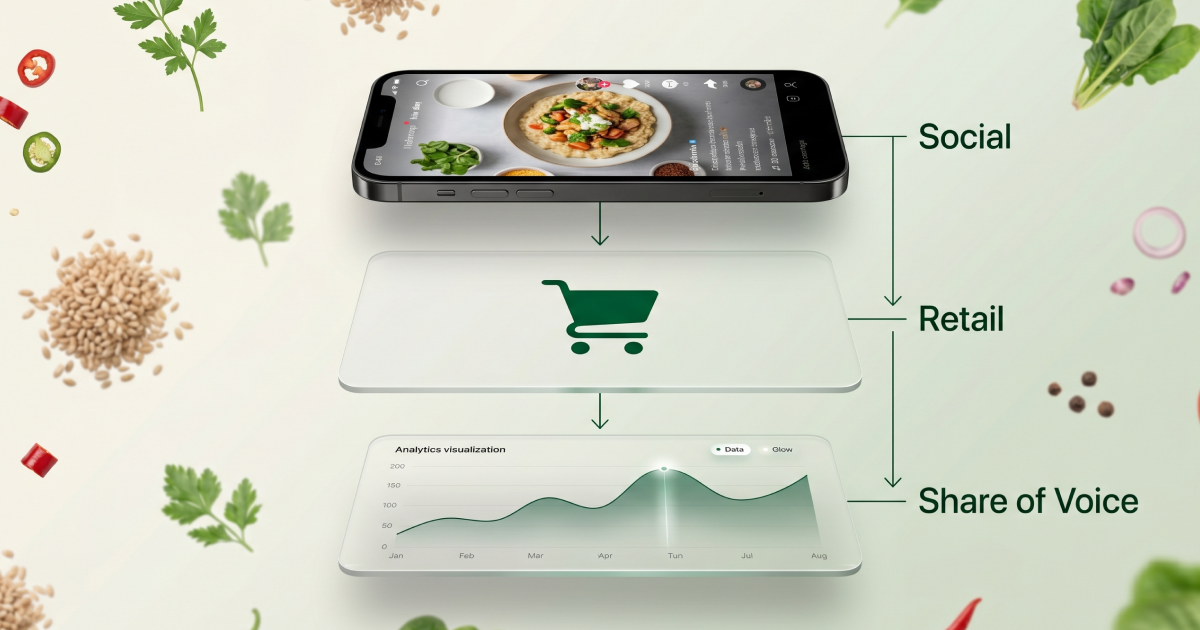
Influencer reporting for CPG brands is the practice of measuring creator campaign performance against the metrics that actually reflect grocery retail outcomes: estimated vs. actual impressions, creator-level cost efficiency, Instacart cart adds, and category share of voice. Most influencer reporting tools were built for DTC brands with a Shopify checkout, which means the standard dashboards measure clicks, affiliate conversions, and UTM-tracked revenue. For food and beverage brands selling through Whole Foods, Kroger, Sprouts, and Instacart, these metrics are either unavailable or misleading.
The result is a reporting gap that most CPG marketing teams work around rather than solve. Impressions and engagement rate get reported to leadership not because they are the right metrics but because they are the only metrics the platform surfaces. The budget conversation that follows is built on the wrong foundation.
This post covers what CPG-specific influencer reporting should actually include, why the standard metrics fall short for grocery retail brands, and how to build a reporting framework that answers the questions leadership actually asks.
Why standard influencer reporting fails for CPG
Standard influencer reporting dashboards report on four things: reach, impressions, engagement rate, and (for DTC) affiliate link conversions. Each of these has a limitation for food CPG brands.
Reach and impressions measure how many people saw the content. They do not measure whether those people were in the right geographic markets (near the stores where the product sells), in the right audience demographic (Whole Foods shoppers versus general consumers), or in active purchase intent at the time of viewing. A campaign that delivers 5 million impressions spread nationally means something different for a brand with national Whole Foods distribution and something completely different for a brand with only Rocky Mountain Kroger placement.
Engagement rate measures likes, comments, shares, and saves as a percentage of views. It is a proxy for content quality and audience receptiveness, and it has real value as a signal. It does not tell you whether engagement translated into in-store trips or Instacart cart adds. A post with 8% engagement that drives zero grocery trips underperforms against a post with 3% engagement that drives 400 Instacart cart adds.
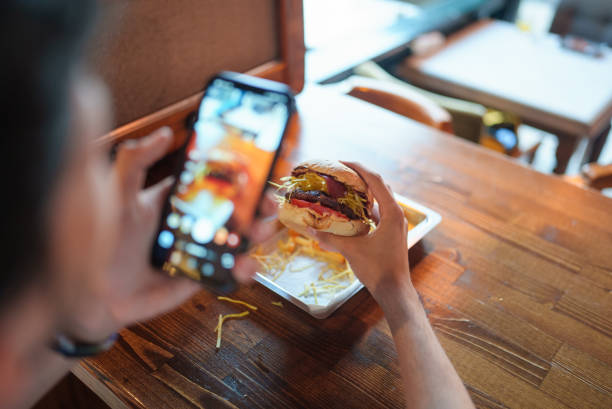
Affiliate link conversions require a brand-controlled DTC checkout to close the attribution loop. CPG brands sell through retailers. There is no DTC checkout for a Sprouts shopper who saw a recipe Reel and drove to Sprouts on Saturday morning. Affiliate tracking was not designed for the CPG purchase journey.
For CPG brands, the reporting problem is structural: the standard tools were built for someone else's business model. The fix is a reporting framework built specifically for the grocery retail purchase journey.
The four metrics CPG influencer reporting should actually cover
1. Estimated vs actual impressions and CPM
This is the performance metric that matters most for campaign execution quality. Every campaign produces an estimated impression count and an estimated CPM before launch, based on creator performance history and budget allocation. Tracking actual delivered impressions against estimated impressions tells you whether the campaign performed as projected or whether the creator selection, brief structure, or timing produced a different result.
Jupiter's campaign health logic formalizes this comparison with clear thresholds: campaigns delivering at or above 80% of estimated impressions are healthy (green), campaigns between 50% and 80% of estimate need creator-level review (yellow), and campaigns below 50% of estimate need structural intervention (red). Tracking this signal mid-campaign, not just at campaign end, allows for in-flight optimization rather than post-campaign diagnosis.
2. Creator-level cost efficiency
Total campaign impressions divided by total campaign spend gives you blended CPM, which is useful but incomplete. Creator-level CPM (cost per thousand impressions per creator) is where the actionable signal lives. A campaign with a healthy blended CPM often hides a top-performing creator at $4 CPM alongside an underperforming creator at $28 CPM. Reporting at the creator level identifies which creators to re-engage for future campaigns and which to replace, which is the primary driver of program efficiency improvement over time.
The metric to track per creator: impressions per dollar spent. Jupiter's analytics dashboard surfaces a creator leaderboard ranked by total impressions and impressions per dollar, which produces a ranked list of creator efficiency that informs both mid-campaign optimization and next-campaign selection.
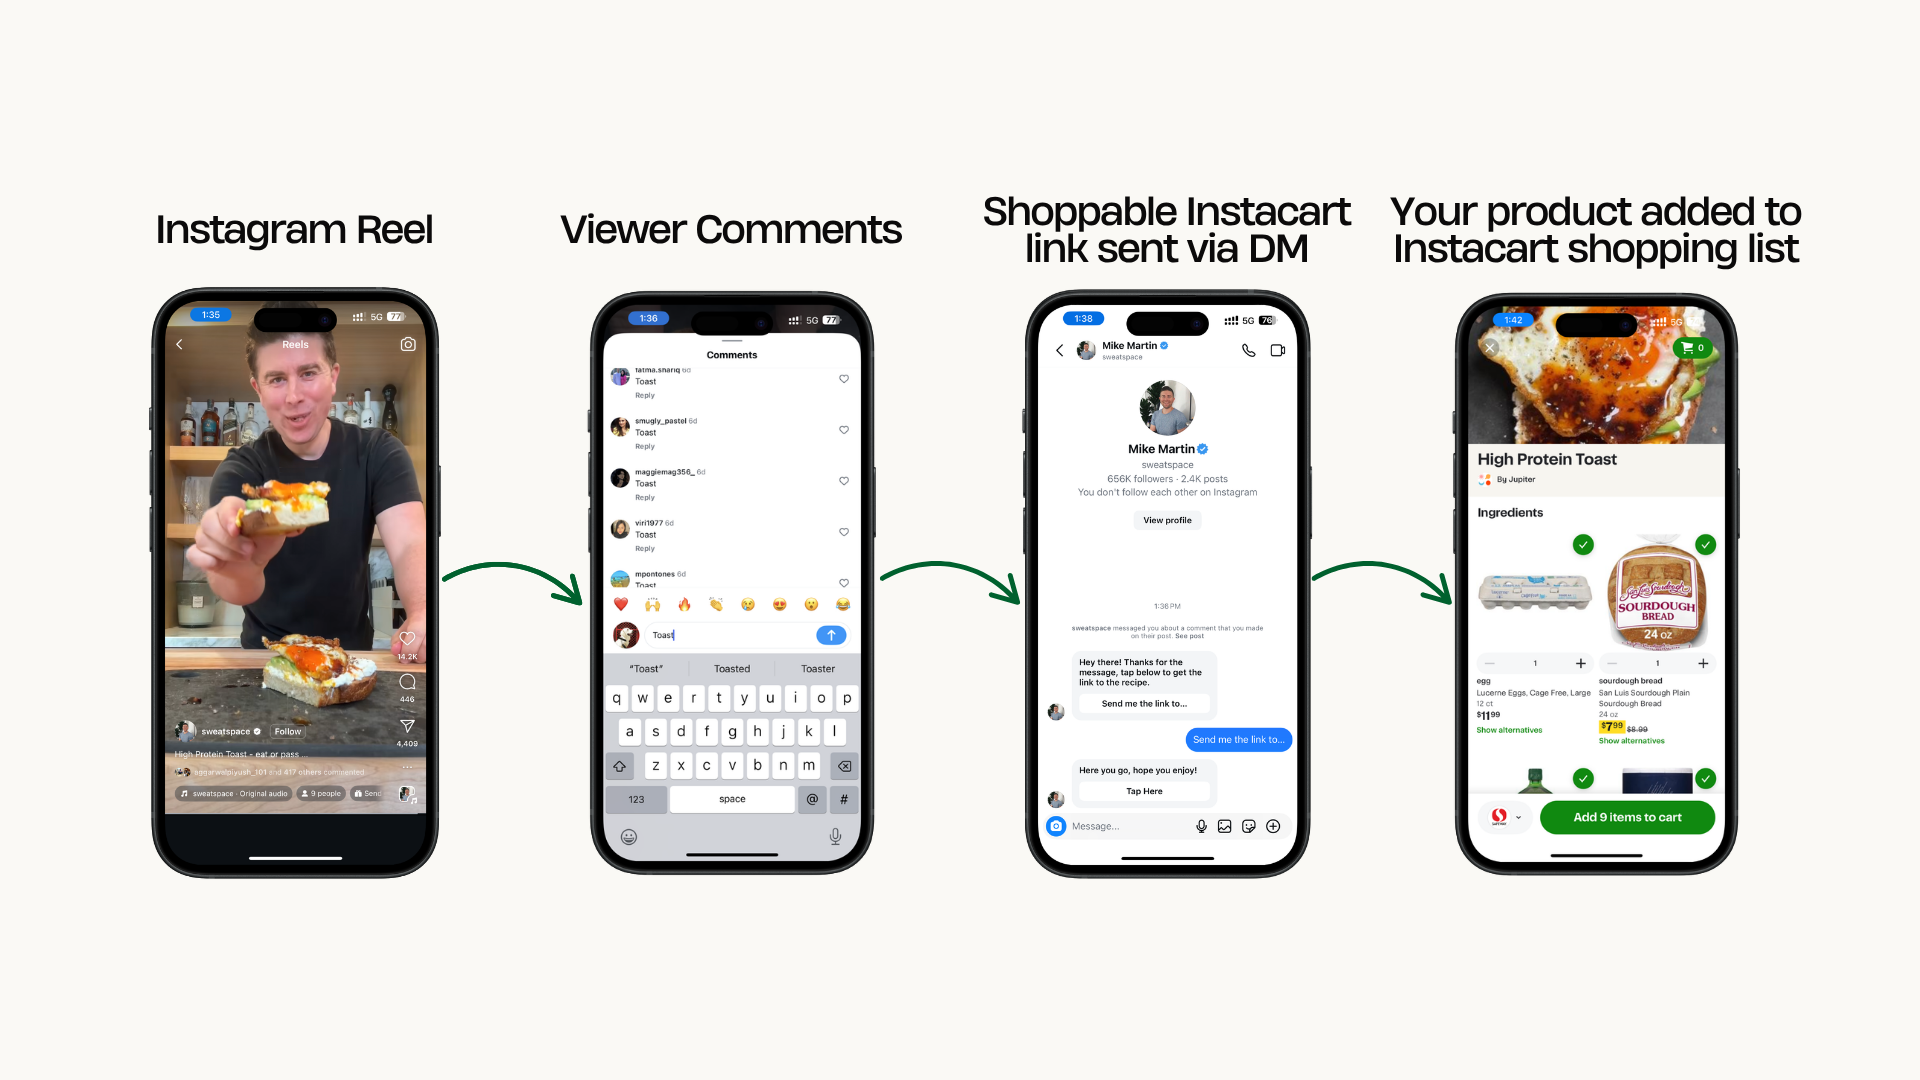
3. Instacart attribution: trackable links and cart adds
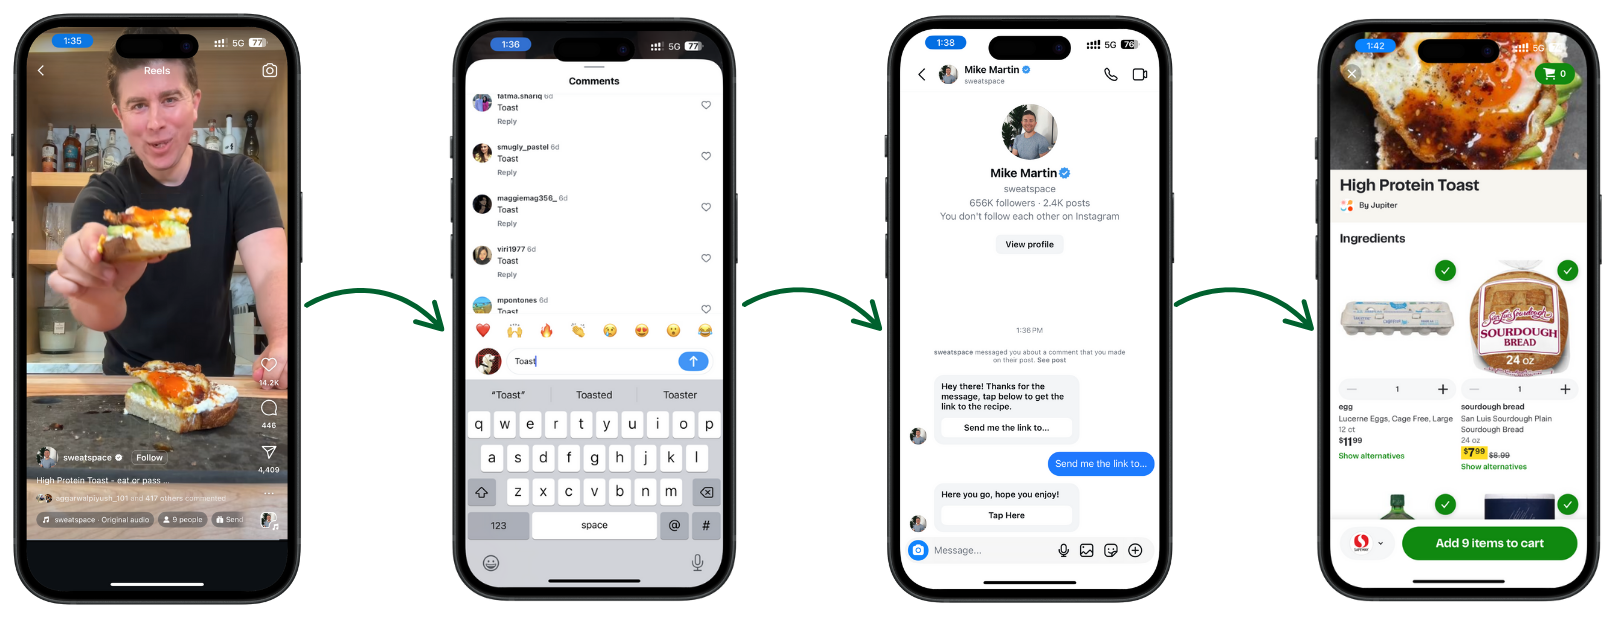
This is the metric that closes the loop between creator content and grocery purchase intent. Jupiter generates per-creator trackable Instacart links for every campaign. Each link is unique to a specific creator and post, redirects to the brand's Instacart product page, and tracks click volume and geographic distribution. For campaigns with the comment-to-DM mechanic active, the platform automatically sends each commenter a unique shoppable link tied to that creator when they comment on the creator's post with a specific keyword, and the resulting Instacart cart adds attribute back to the specific creator and post that drove them.
The four Instacart attribution numbers that matter in post-campaign reporting: total Instacart-bound clicks attributed to the campaign, cost per click (total campaign spend divided by Instacart clicks), top-performing creators by Instacart clicks (which is often different from the top performer by impressions), and geographic distribution of clicks. This last metric tells you whether the campaign reached the right markets, which is the question retailer-windowed campaigns need to answer.
Our complete Instacart attribution guide covers the full four-layer ROI framework in detail.
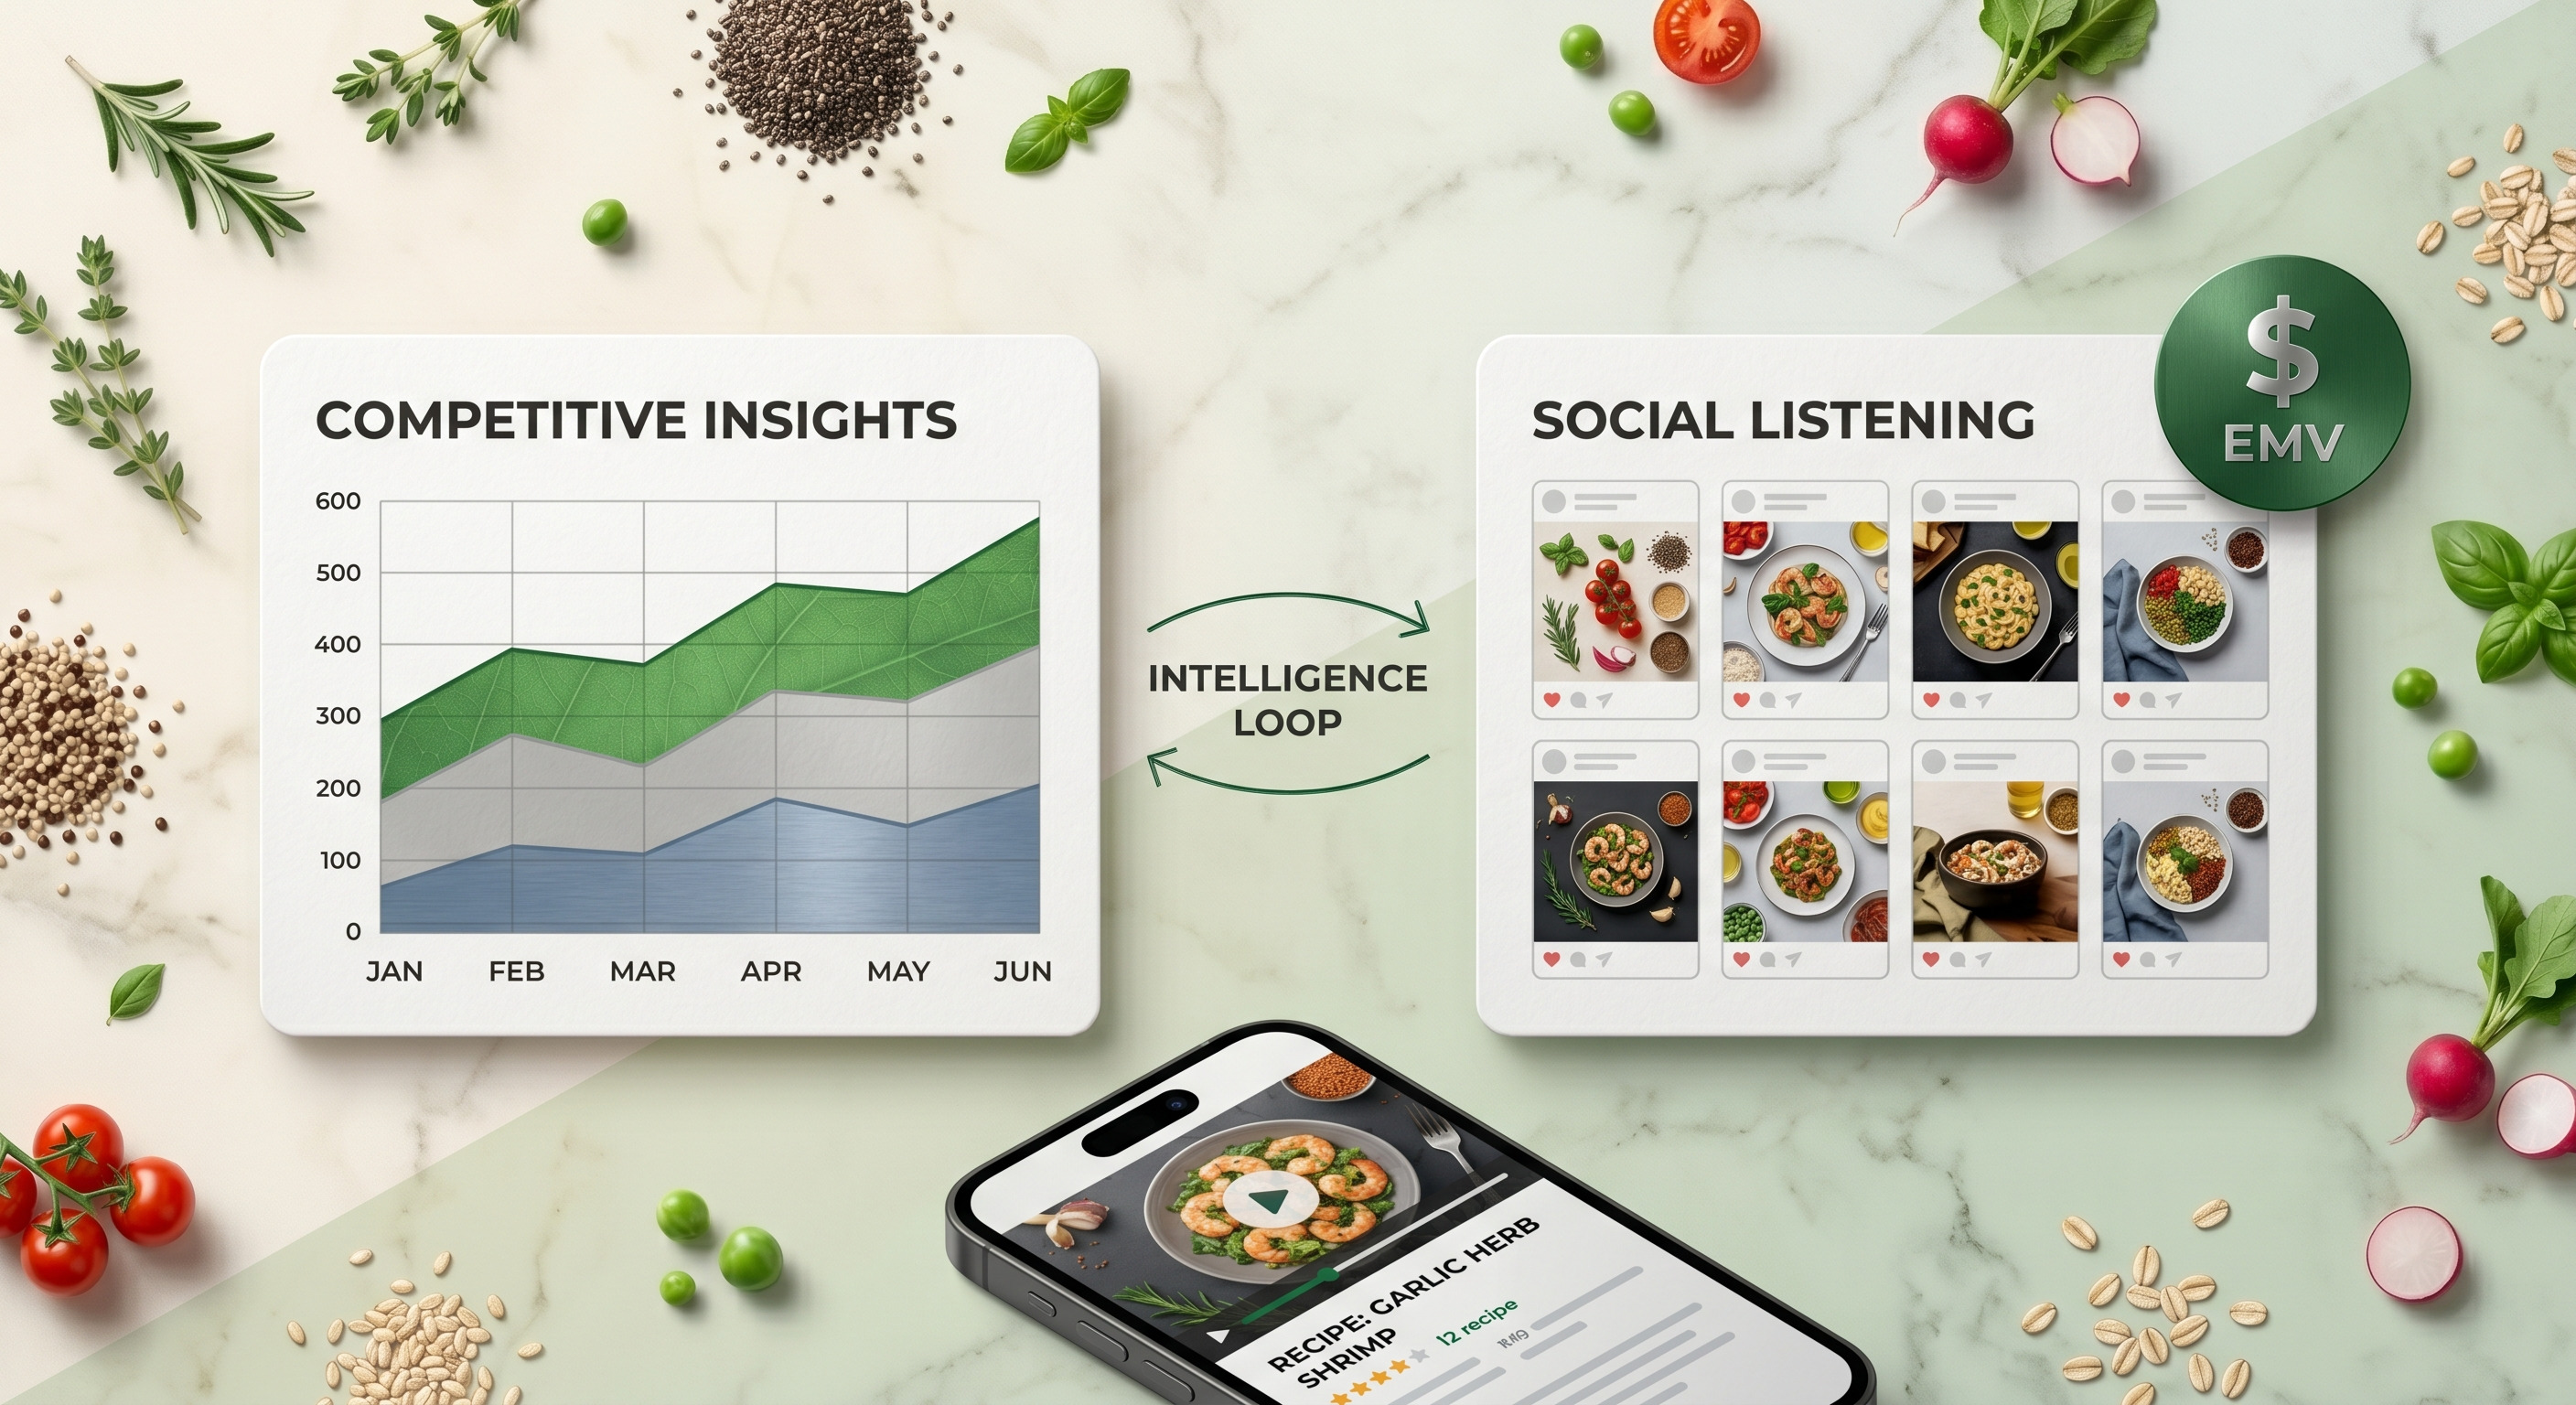
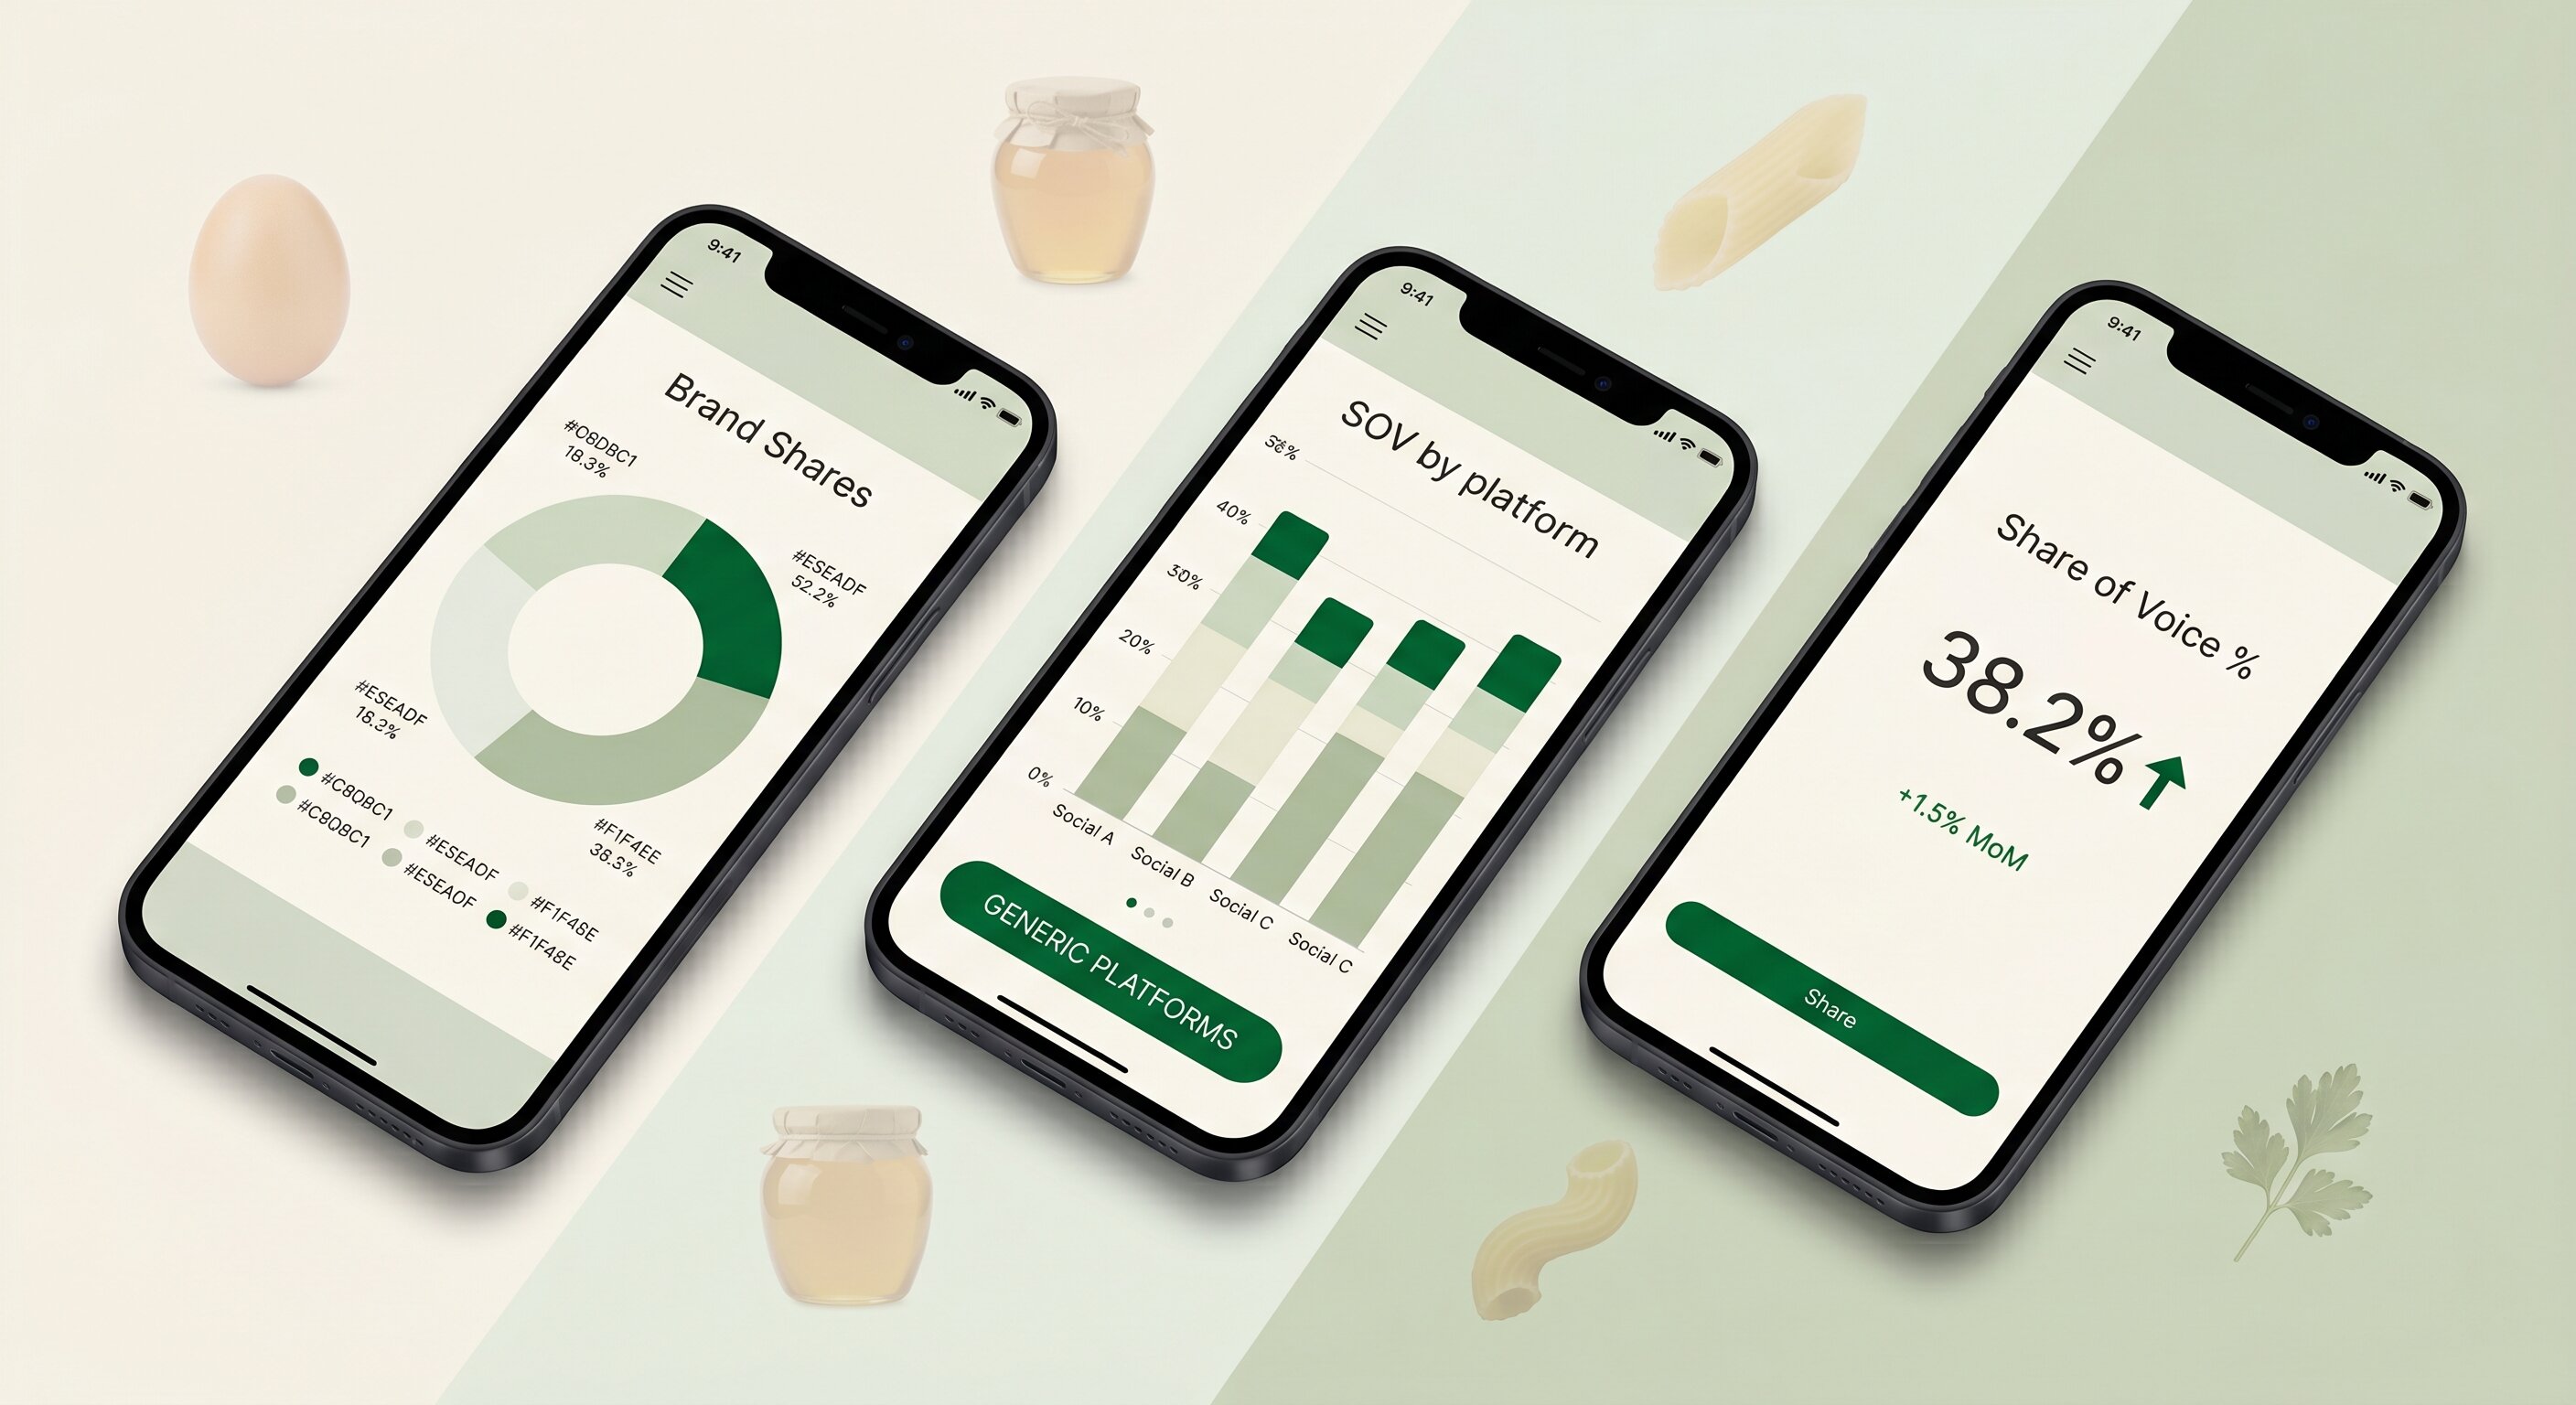
4. Share of voice movement
Share of voice is the brand-equity metric that standard influencer reporting ignores entirely. It measures what percentage of category conversation on Instagram, TikTok, YouTube, and X belongs to your brand versus competitors during the campaign window. A campaign that increases your food category SOV from 8% to 14% is generating real market share value that will not appear in your link click dashboard but will show up in long-term brand consideration data.
Jupiter's share of voice tracking tracks owned versus earned mentions, platform-by-platform breakdown, and competitive category conversation share continuously. Comparing SOV during a campaign window against baseline periods gives the brand-equity dimension of campaign performance that impressions and engagement cannot capture.
See what CPG-specific influencer reporting looks like in Jupiter
Estimated vs actual impressions, creator-level cost efficiency, Instacart cart-add attribution, and share of voice tracking in one dashboard built for food and beverage CPG brands.
Building a reporting cadence that actually gets used
Reporting frequency matters as much as reporting content. Most CPG teams produce one post-campaign report after the campaign ends. By then, the optimization window has closed and the data only informs the next campaign. A reporting cadence that drives action looks different.
Weekly during active campaigns. Creator-level impressions, estimated vs. actual pace, and Instacart click volume. This is the data that informs mid-campaign decisions: which creators to accelerate, which to re-brief, which to pause.
At campaign end. Full performance summary covering all four metric categories: impressions and CPM versus estimate, creator-level efficiency leaderboard, Instacart attribution total with geographic distribution, and SOV movement during the campaign window versus baseline. This is the report that goes to leadership.
Quarterly program review. Aggregate across campaigns: which creator profiles consistently outperform, which campaign types (recipe format, product review, ingredient swap) drive the strongest Instacart conversion, which retailer markets respond most strongly to creator content. This is the report that informs next quarter's budget allocation and creator roster decisions.
The reporting questions that matter to CPG leadership
The most useful test for any influencer reporting framework is whether it can answer the questions CPG marketing leadership actually asks. Five questions come up consistently:
"Did this campaign drive sales?" → Answered by Instacart cart adds and geographic click distribution mapped to retailer markets.
"Which creators are worth working with again?" → Answered by the creator-level cost efficiency leaderboard (impressions per dollar, not total impressions).
"Is this campaign performing as projected?" → Answered by the estimated vs. actual impressions health indicator.
"Are we winning the conversation in our category?" → Answered by share of voice movement during the campaign window.
"What should we do differently next time?" → Answered by the combination of creator-level efficiency data, Instacart geographic distribution, and SOV delta.
A reporting dashboard that cannot answer all five of these questions is measuring the wrong things for a CPG brand. Jupiter's analytics dashboard is structured specifically around these five questions, with the Jupiter AI marketing agent able to pull any of these data points in plain language: "show me which creators drove the most Instacart clicks last quarter" or "how did our SOV change during the Whole Foods endcap campaign?"
Still reporting on impressions and engagement for your CPG campaigns?
See what Instacart attribution, creator-level cost efficiency, and share of voice tracking look like when they are built into the platform rather than added on.
How Jupiter handles influencer reporting for food CPG
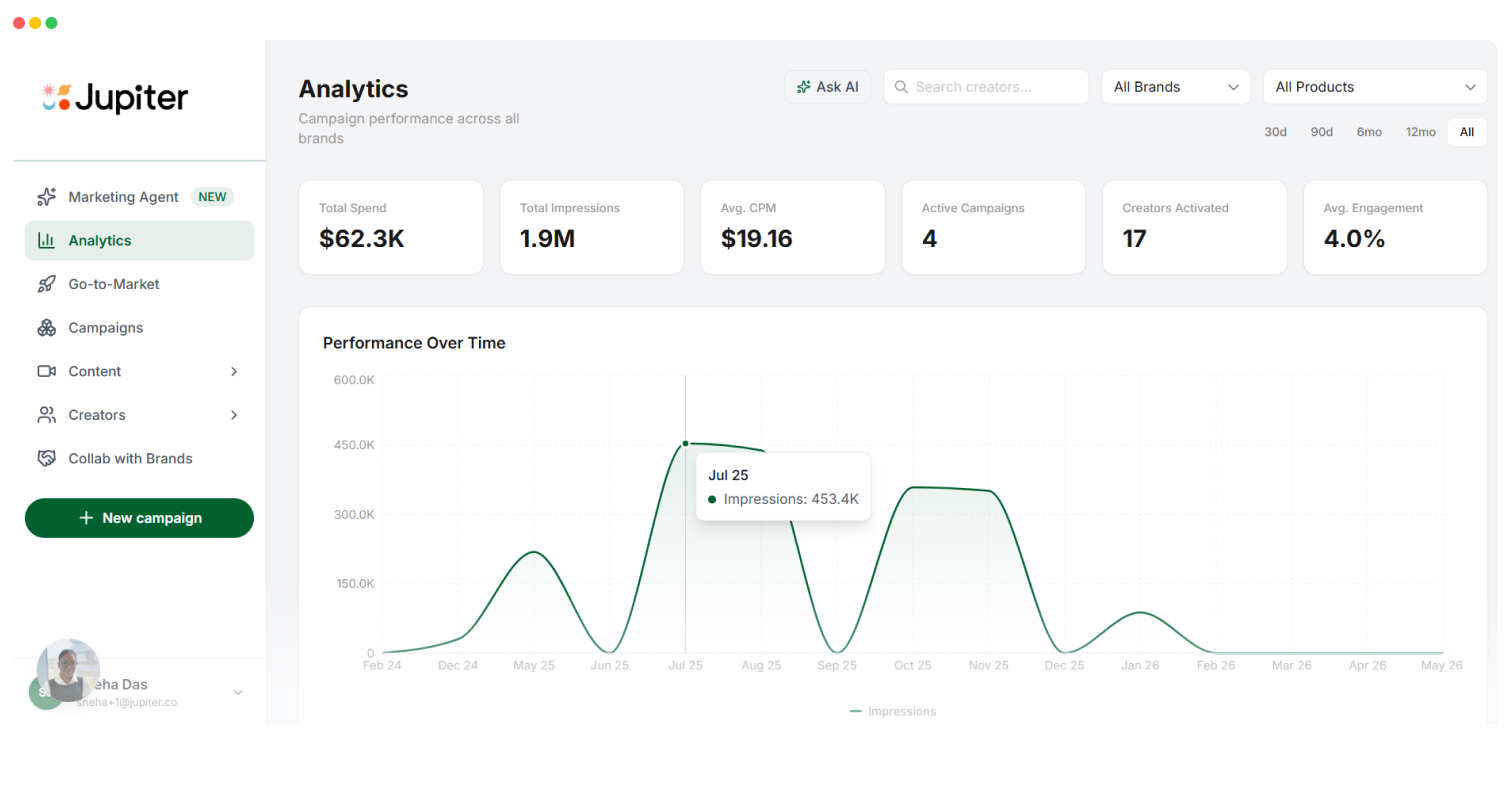
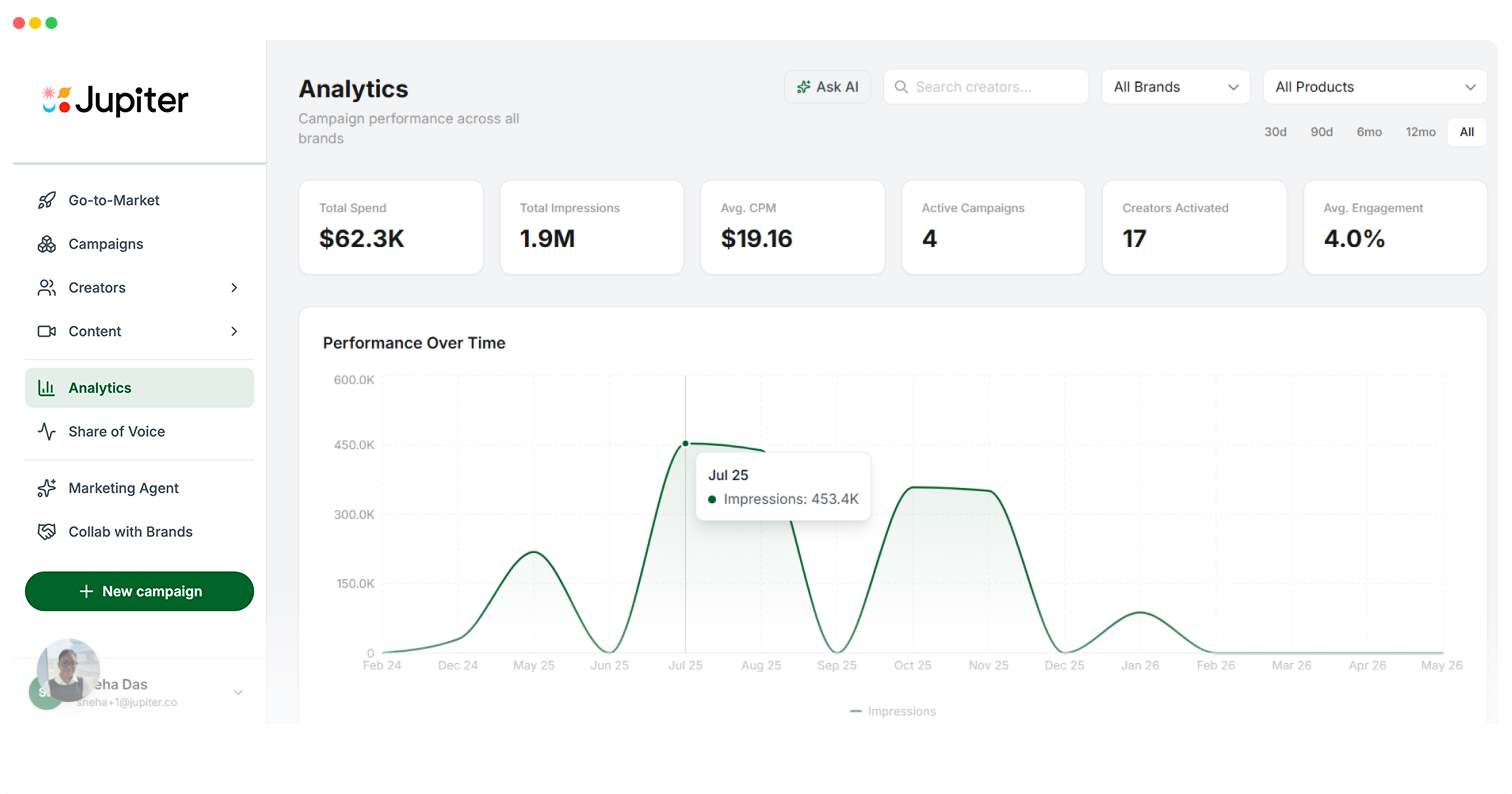
Jupiter's analytics dashboard is built specifically for the food CPG reporting use case. Six headline KPIs with period-over-period deltas: total spend, total impressions, average CPM, active campaigns, creators activated, and average engagement rate. A creator leaderboard ranked by total impressions and impressions per dollar. Campaign health indicators comparing estimated vs. actual impressions in real time. Instacart-bound trackable link clicks broken down by creator and geographic distribution. Posted content feed with per-post engagement metrics updated continuously. Category share of voice across Instagram, TikTok, YouTube, and X.
The Jupiter AI marketing agent is a 20-tool conversational assistant that surfaces any of this data in plain language. Pull a creator leaderboard for the last three campaigns, compare estimated CPM against actual CPM across active campaigns, or get a brand-level performance summary by product. For food CPG marketing teams who need to pull a leadership report in 15 minutes rather than spend an afternoon in a spreadsheet, the agent changes the operational reality of campaign reporting.
For the full attribution framework underlying this reporting model, our influencer marketing ROI guide covers the four-layer measurement model. For platform comparison on reporting depth, our best food influencer marketing platforms review covers how Jupiter's reporting compares to Aspire, GRIN, CreatorIQ, and Upfluence.
Build influencer reporting that actually answers leadership's questions.
Estimated vs actual impressions, creator-level cost efficiency, Instacart cart-add attribution, and share of voice movement in one dashboard built exclusively for food and beverage CPG brands.
FAQs
Quick answers to common questions.
What should CPG brands include in influencer marketing reports?▼
CPG influencer reports should cover four metric categories: estimated vs. actual impressions and CPM (to evaluate campaign execution quality), creator-level cost efficiency measured as impressions per dollar (to identify top performers for future campaigns), Instacart attribution data including trackable link clicks and cart adds by creator (to connect creator content to grocery purchase intent), and category share of voice movement during the campaign window (to capture brand-equity value that direct attribution does not).
Why is standard influencer reporting insufficient for CPG brands?▼
Standard influencer reporting is built for DTC brands with a Shopify checkout, and it reports on reach, engagement, and affiliate link conversions. CPG brands sell through grocery retail and Instacart, not through a brand-controlled checkout, which means affiliate tracking cannot close the attribution loop. The metrics that matter for CPG (Instacart cart adds, retailer-specific geographic engagement, sell-through lift, and category share of voice) require a reporting framework built specifically for the grocery retail purchase journey.
How do CPG brands measure influencer marketing ROI without a DTC checkout?▼
CPG brands measure influencer marketing ROI through four proxy signals: estimated vs. actual impressions and CPM as execution quality indicators, creator-level cost efficiency (impressions per dollar) as a relative value signal, Instacart trackable link clicks and cart adds per creator as the closest available proxy for grocery purchase intent, and category share of voice movement during the campaign window as a brand-equity signal. For brands with retailer data access, sell-through lift at the store level during the campaign window is the most direct ROI signal available.
What is a good CPM for food CPG influencer campaigns?▼
CPM benchmarks for food CPG influencer campaigns vary significantly by creator tier, platform, and content format. Mid-tier creators (50K to 250K followers) on Instagram typically deliver CPMs in the range of $5 to $20 per thousand impressions on an organic basis. TikTok CPMs tend to run lower for the same creator tier due to higher algorithmic reach. The more useful metric than absolute CPM is relative CPM: how does a creator's actual delivered CPM compare to their estimated CPM going into the campaign, and how does each creator's CPM compare to others in the same campaign?
How often should CPG brands report on influencer campaigns?▼
CPG brands should report weekly during active campaigns (to enable mid-campaign optimization), at campaign end (full performance summary for leadership), and quarterly across programs (aggregate creator efficiency, campaign type analysis, and retailer market response patterns). Post-campaign-only reporting closes the optimization window and limits the data to informing the next campaign rather than improving the current one.
What is creator-level cost efficiency and why does it matter for CPG reporting?▼
Creator-level cost efficiency is total impressions delivered by a creator divided by the total cost of that creator's posts, expressed as impressions per dollar. It matters because blended campaign CPM hides significant variation at the creator level: a campaign with a healthy average CPM often includes one creator delivering impressions at $4 per thousand and another at $28 per thousand. Reporting at the creator level identifies which creators to re-engage and which to replace, which is the primary mechanism for improving program efficiency over time.
Related Posts
Browse more from our blog.