Cost Per Engagement in Influencer Marketing: How to Calculate and Optimize CPE
Cost per engagement measures the real efficiency of influencer campaigns beyond vanity metrics. Here's how CPG brands calculate CPE, interpret benchmarks by platform and creator tier, and optimize campaigns to improve performance.

Trusted by leading CPG brands

Cost per engagement (CPE) in influencer marketing measures the total campaign spend divided by the total number of engagements generated across all creator content. For food and beverage CPG brands, CPE reveals whether your creator budget is producing audience interaction efficiently, or whether you are paying for reach that does not translate into meaningful engagement. While follower count offers a rough estimate of potential audience size, CPE shows the actual cost to generate each like, comment, share, and save from real viewers who took action.
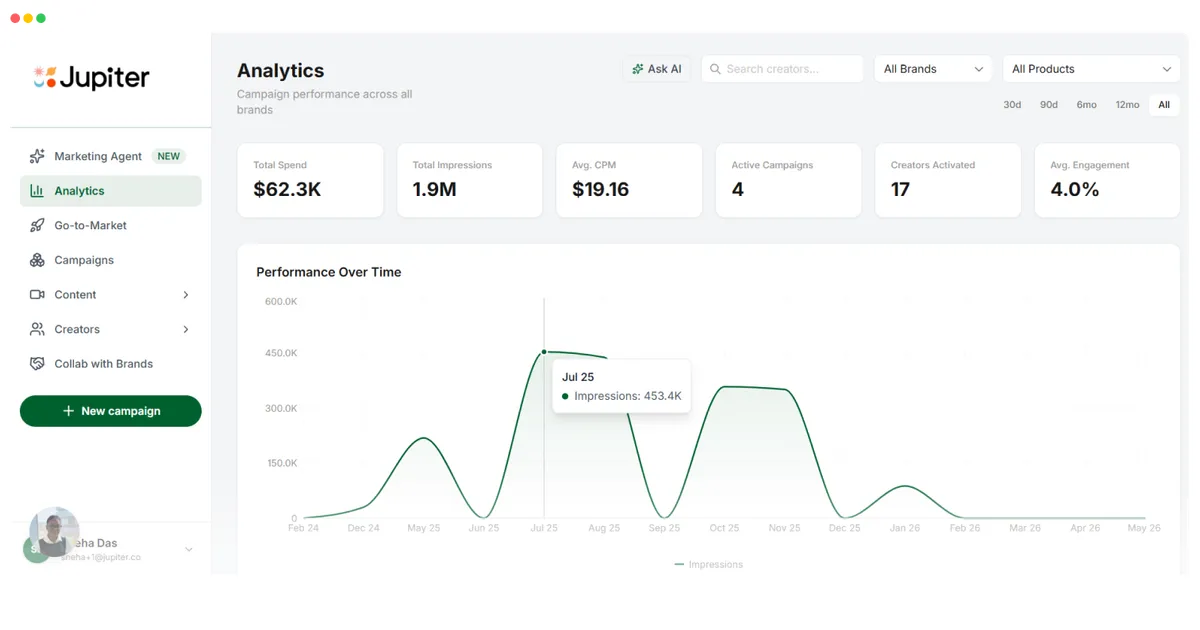
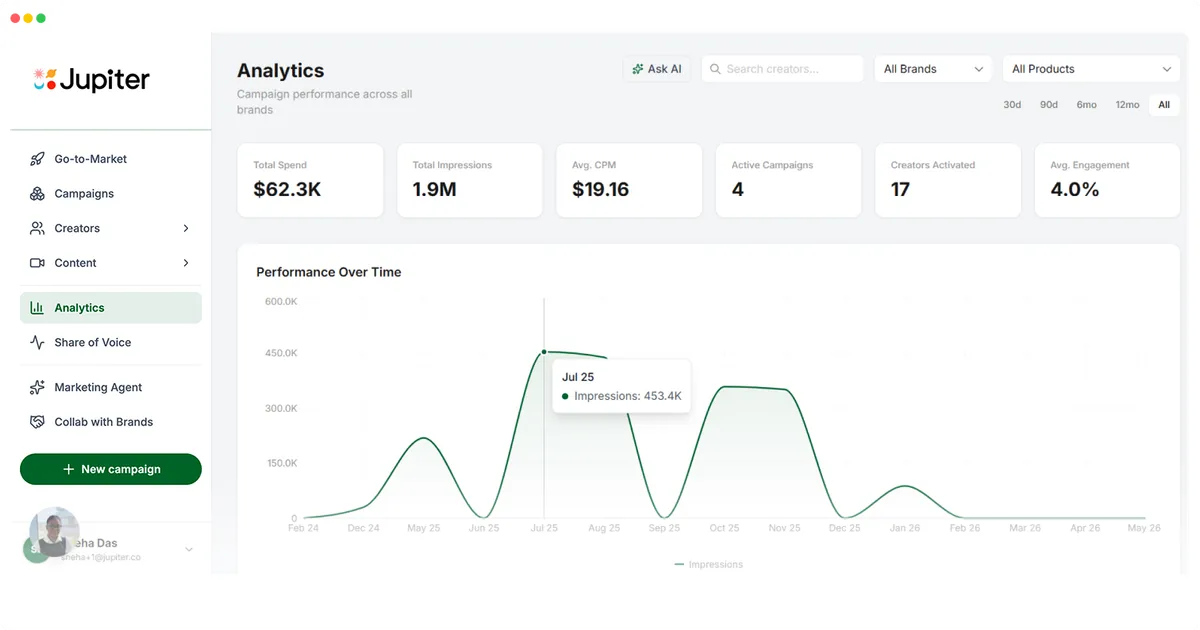
Most CPG marketing teams track impressions and CPM as primary campaign metrics. Those numbers matter for awareness measurement, but they do not capture whether viewers actually engaged with the content. A creator can deliver millions of impressions at a low CPM, yet produce zero meaningful audience interaction. CPE fills that gap by connecting spend directly to audience behavior. Used by 58+ leading CPG brands including Banza, Pete & Gerry's, and Kettle & Fire, Jupiter tracks CPE alongside CPM and Instacart cart attribution to give food brands the full performance picture.
How to Calculate Cost Per Engagement for Influencer Campaigns
The formula for cost per engagement is straightforward. Take the total campaign budget and divide it by the total number of engagements across all posts and creators. Engagements include likes, comments, shares, and saves. The formula looks like this:
If a campaign costs $10,000 and generates 50,000 engagements (likes, comments, shares, saves combined), the CPE is $0.20. That means each interaction cost twenty cents. The lower the CPE, the more efficiently the campaign generated audience interaction relative to spend.
For multi-creator campaigns, calculate CPE at both the campaign level and the individual creator level. Campaign-level CPE shows overall efficiency. Creator-level CPE reveals which specific creators deliver the lowest cost per engagement, and which drive engagement rates that justify higher creator fees. A macro creator charging $8,000 per post might deliver a higher CPE than a micro creator charging $800 per post if the macro creator's engagement rate is significantly lower.
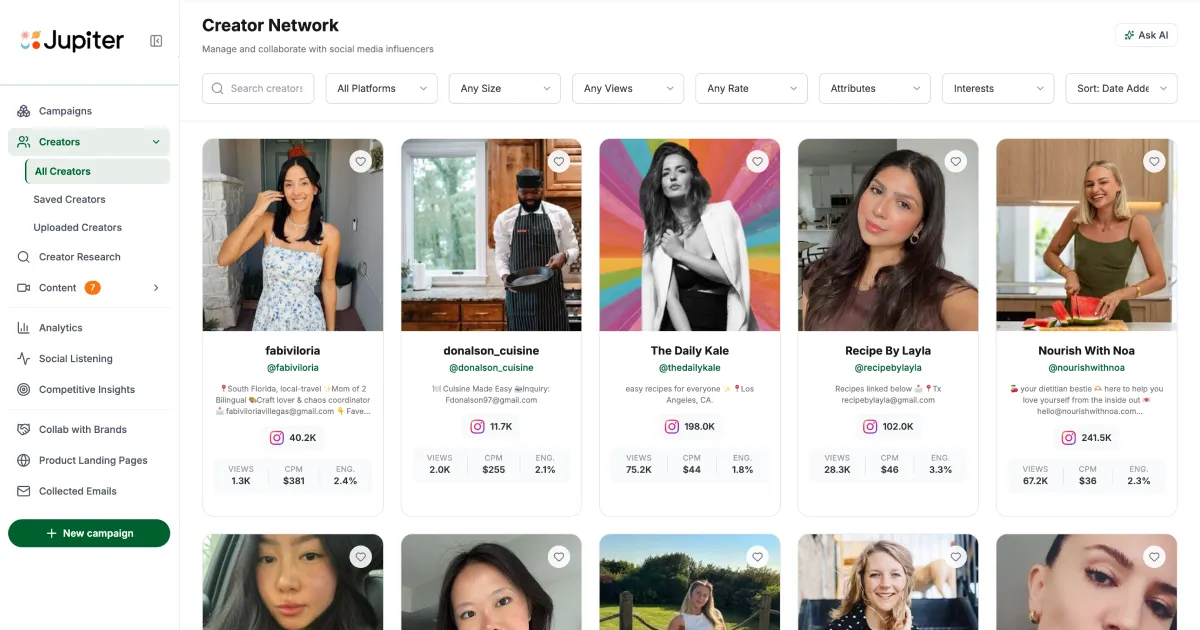
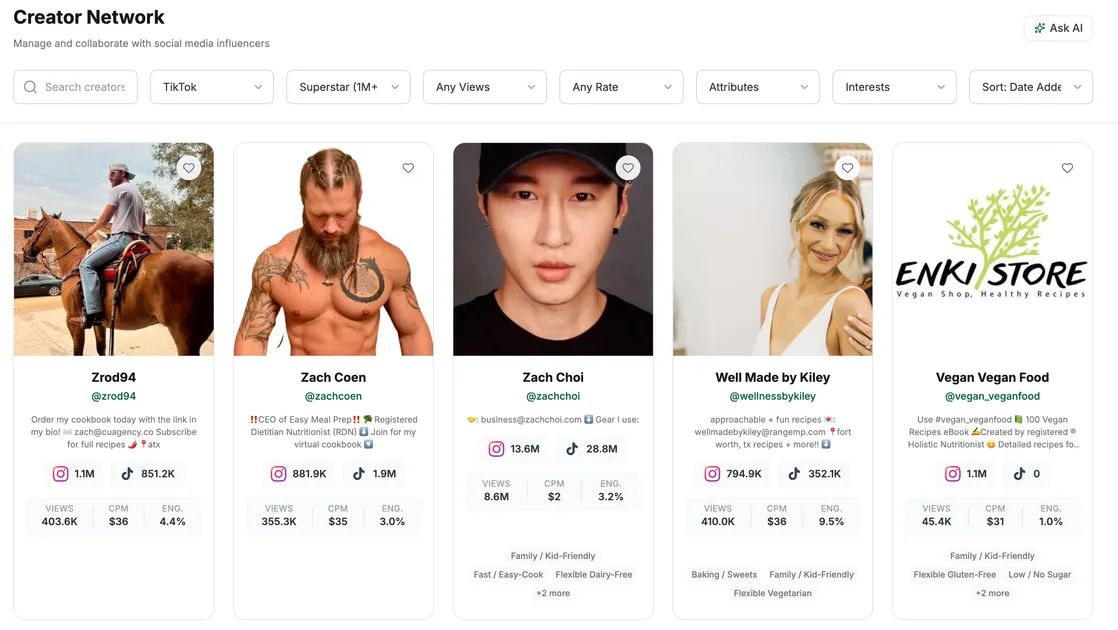
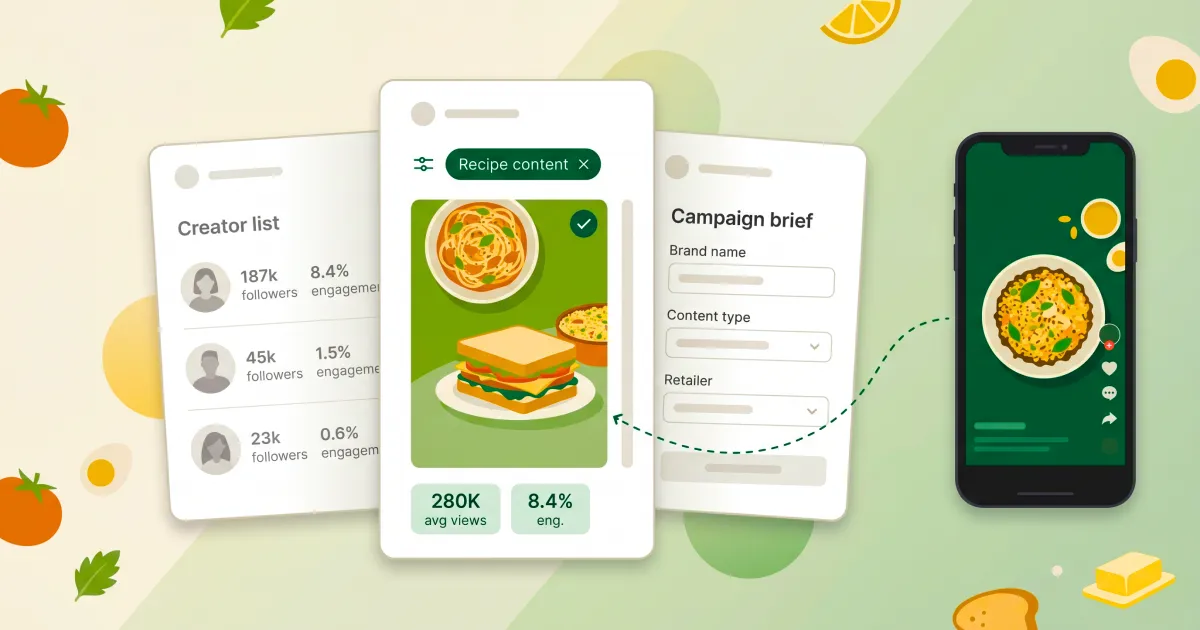
Jupiter calculates CPE automatically for every campaign and every creator post. The platform's 12-signal campaign optimizer selects creators based not just on follower count, but on predicted engagement quality, content recency, and audience credibility signals that correlate with stronger engagement performance. That optimization happens before the campaign launches, reducing wasted spend on creators whose audiences do not engage consistently.
See Your Campaign CPE Before You Spend
Jupiter's campaign optimizer predicts engagement performance by creator tier and post type, so you can model CPE before committing budget. See the platform in action.
Cost Per Engagement Benchmarks: Instagram vs TikTok for CPG Brands
CPE varies significantly by platform, creator tier, and content type. Instagram still delivers 73.7% of impressions from food CPG creator campaigns, and Instagram Reels tend to generate higher engagement rates than static feed posts. TikTok accounts for 26.3% of impressions but often produces higher engagement rates per view due to the platform's algorithm prioritizing watch time and interaction.
Across Jupiter campaigns, Instagram CPE for food and recipe creators typically ranges from $0.15 to $0.45 depending on creator tier and content format. TikTok CPE runs slightly lower on average, between $0.10 and $0.35, reflecting the platform's stronger organic engagement rates. These benchmarks apply specifically to food and recipe content, where audience intent is higher and engagement includes recipe saves and comment questions about ingredients or substitutions.
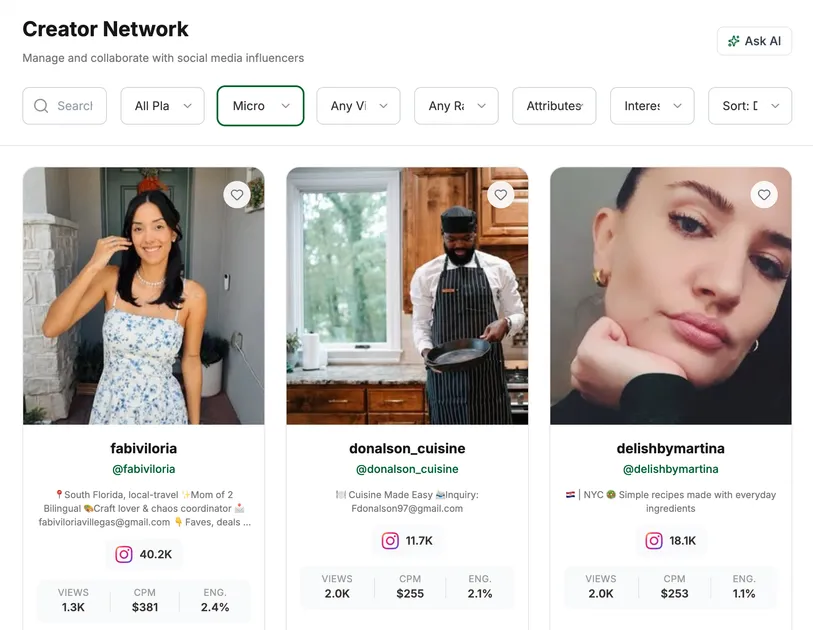
Creator tier plays a larger role than platform in determining CPE. Nano creators (1K-10K followers) and micro creators (10K-50K followers) consistently deliver lower CPE than macro and mega creators because their audiences engage at higher rates. A micro influencer with 40,000 followers might charge $800 per post and generate 4,000 engagements, producing a CPE of $0.20. A macro creator with 500,000 followers might charge $6,000 per post and generate 18,000 engagements, resulting in a CPE of $0.33.
Jupiter data shows that micro creators in the 10K-50K range deliver 4x-7x higher comment-to-view ratios than macro creators. Comments represent deeper engagement than passive likes, and they signal stronger audience trust. For CPG brands measuring not just total engagement volume but engagement quality, micro creators offer better CPE and better conversion potential further down the funnel.
How to Optimize Cost Per Engagement Through Creator Selection
The fastest way to improve CPE is to select creators whose audiences already engage consistently. Historical engagement rate is the strongest predictor of future engagement performance. A creator with a 5% engagement rate will almost always deliver better CPE than a creator with a 2% engagement rate, even if the higher-engagement creator charges a premium.
Jupiter's campaign optimizer evaluates 12 signals before recommending creators for a campaign, including engagement quality, view consistency, audience credibility, and content recency. The platform flags creators whose engagement rates have declined recently or whose audiences show credibility issues like bot-like behavior or low geographic alignment with the brand's retail footprint. Removing those creators from the roster improves campaign-level CPE before the first post goes live.
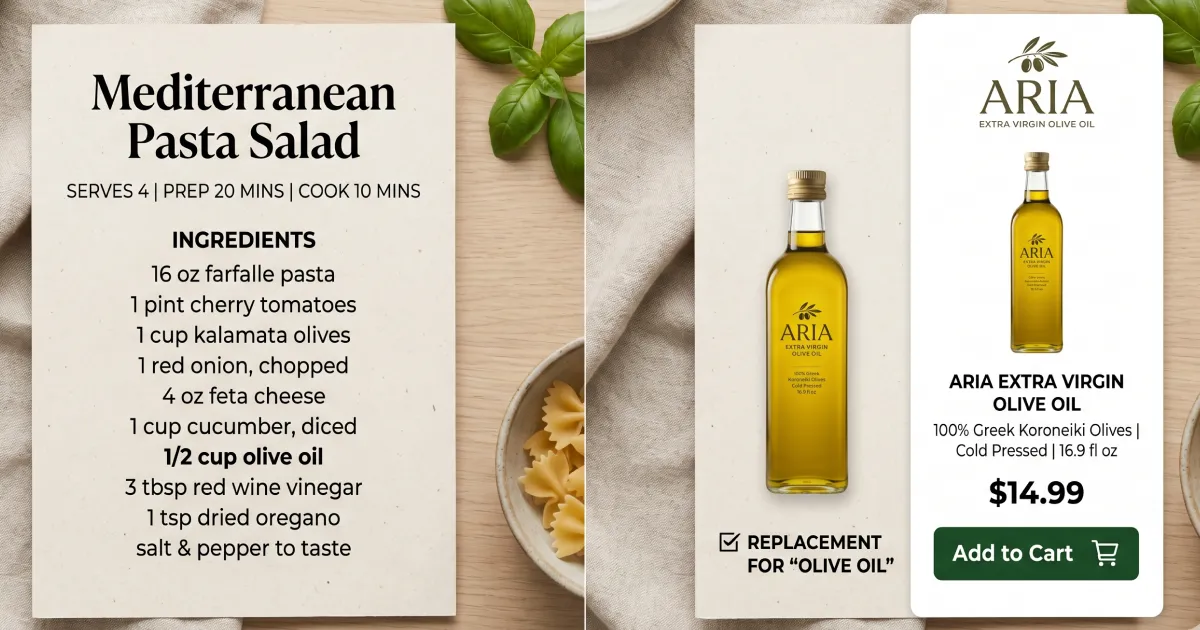
Beyond historical engagement rate, prioritize creators whose content format matches the campaign goal. Recipe video content generates higher engagement rates than product-only content because viewers save recipes, comment with questions, and tag friends who might want to try the dish. A plant-based pasta brand running a 6-creator macro campaign delivered 25.9M impressions at $2.47 CPM with a 3.6% average engagement rate. That same brand's 1-creator ambassadorship featuring recipe-focused content delivered 70.1M impressions at $1.25 CPM with a 5.1% engagement rate. The CPE difference reflects both the creator's audience quality and the content format's inherent engagement potential.
Geographic alignment also impacts CPE. If your brand distributes primarily in the Southeast but you select a creator whose audience is 70% West Coast, engagement may occur, but those engagements are less likely to convert into grocery sales. Jupiter tracks retailer proximity as one of the 12 optimizer signals, connecting creator audience location to store distribution data. Better geographic match improves not just CPE but downstream conversion.
Running Campaigns Without Visibility Into CPE Performance?
Most CPG brands discover their cost per engagement was inefficient only after the campaign ends. Jupiter shows you predicted and real-time CPE so you can adjust mid-flight and protect your budget.
Cost Per Engagement vs CPM vs CPA: When to Prioritize Each Metric
CPE, CPM, and CPA measure different outcomes, and the right metric to prioritize depends on campaign goals. CPM (cost per thousand impressions) measures awareness efficiency. CPE measures engagement efficiency. CPA (cost per acquisition or action) measures conversion efficiency. All three matter, but they answer different questions.
Use CPM when the campaign goal is brand awareness or reaching new audiences. A specialty oil brand running a 52-week ambassadorship with a macro creator delivered 20.8M impressions at $4.93 CPM. That CPM is higher than the category average, but the campaign's goal was sustained visibility among a specific audience segment. CPM was the right metric to track.
Use CPE when the campaign goal is generating audience interaction, social proof, or content that signals brand affinity. A plant-based pasta brand running a 4-week macro creator campaign delivered 15.0M impressions at $2.12 CPM with a 4.5% engagement rate. The engagement rate translated into hundreds of thousands of likes, comments, and saves that demonstrate audience interest. CPE quantifies the cost to generate each of those signals.
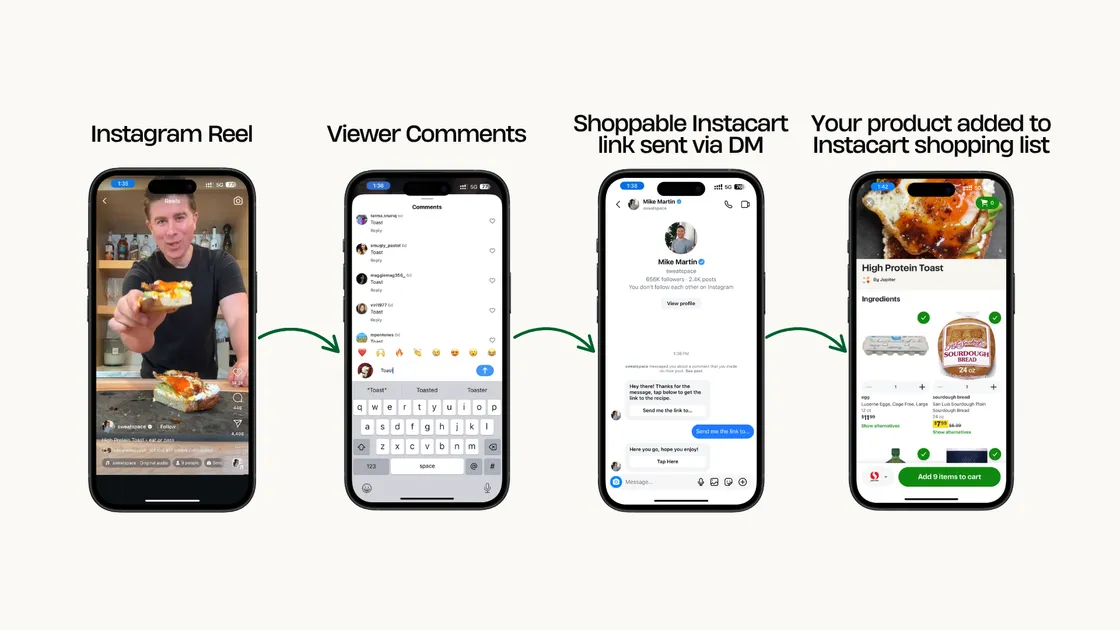
Use CPA when the campaign goal is driving a measurable action like an Instacart cart add, a website visit, or a coupon download. Jupiter's Instacart attribution mechanic connects creator content directly to cart adds through a comment-triggered DM system. When a viewer comments a keyword on a creator post, they receive an automated DM with a unique shoppable Instacart link tied to that creator and post. Cart adds attribute back to the specific creator and post, enabling true CPA measurement. One Instagram Reel delivered 6.5 million views and over 1,000 Instacart cart adds. The CPA for that campaign was a fraction of traditional retail media cost per acquisition.
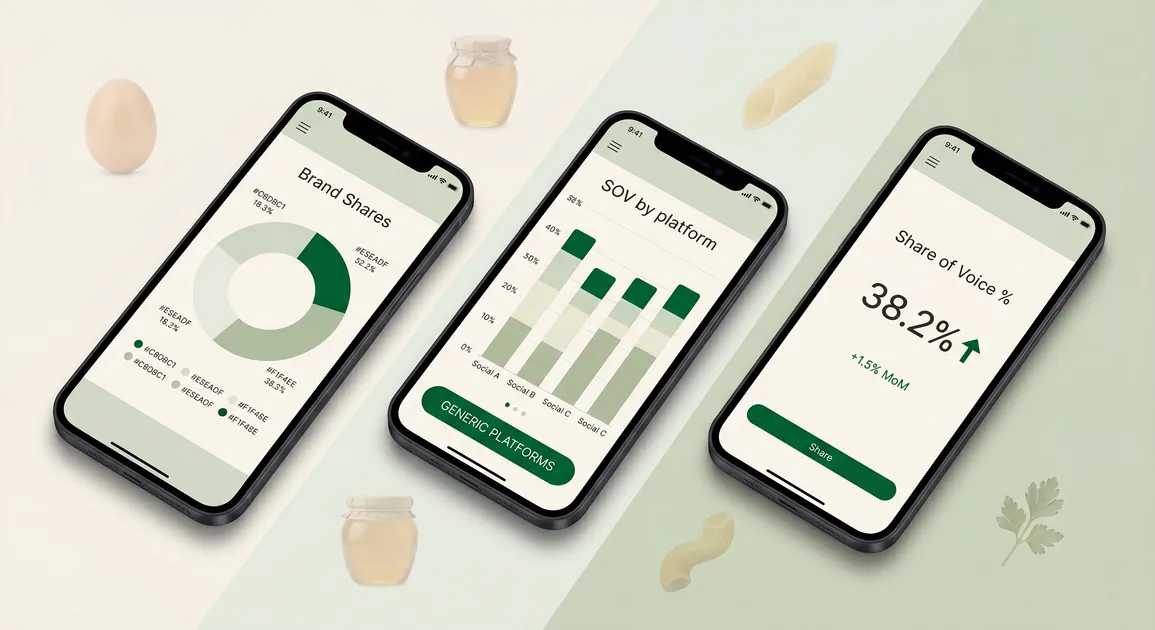
Most successful CPG influencer campaigns track all three metrics. CPM shows whether you are paying a fair rate for reach. CPE shows whether that reach is translating into meaningful audience interaction. CPA shows whether that interaction is converting into measurable demand. Jupiter tracks all three in real time, with campaign health dashboards that flag underperformance before budget is wasted.
Real CPG Campaign CPE Analysis
A specialty oil brand ran a 30-week ambassadorship with a single macro creator, budgeting $52,500 for 44 posts. The campaign delivered 10.8M impressions at $5.33 CPM with a 4.3% average engagement rate. Total engagements across all 44 posts reached approximately 464,000 (calculated as 10.8M impressions × 4.3% engagement rate). Dividing the $52,500 budget by 464,000 engagements produces a CPE of approximately $0.11.
That CPE reflects several optimization choices. First, the campaign used a single creator rather than rotating through multiple creators, allowing the audience to build familiarity and trust over 30 weeks. Second, the creator's content format focused on recipe videos featuring the oil as a key ingredient, which generates higher engagement than product-only content. Third, the 44-post cadence (roughly 1.5 posts per week) kept the brand visible without oversaturating the feed.
Compare that to a plant-based pasta brand's 4-week campaign with 6 macro creators. The campaign delivered 25.9M impressions at $2.47 CPM with a 3.6% engagement rate. Total engagements reached approximately 932,000. The $63,900 budget divided by 932,000 engagements produces a CPE of approximately $0.07. The lower CPE reflects the shorter campaign duration, the higher total engagement volume from deploying six creators simultaneously, and the pasta category's naturally high engagement rates driven by recipe content.
Both campaigns succeeded, but they optimized for different outcomes. The oil brand prioritized sustained visibility and long-term audience relationship building. The pasta brand prioritized rapid engagement volume to support a product launch. Understanding when to prioritize each approach requires clarity on business goals, distribution stage, and competitive context.
See How Jupiter Optimizes CPE for Food Brands
Used by 58+ CPG brands including Banza and Kettle & Fire, Jupiter's 12-signal optimizer selects creators based on predicted engagement performance, not just follower count. See your projected CPE before you commit budget.
FAQs
Quick answers to common questions.
What is cost per engagement in influencer marketing?▼
Cost per engagement (CPE) is the total campaign spend divided by the total number of engagements generated across all creator posts. Engagements include likes, comments, shares, and saves. CPE measures the efficiency of your influencer budget in generating actual audience interaction, not just impressions.
What is a good cost per engagement for CPG influencer campaigns?▼
For food and beverage CPG brands, a competitive CPE typically ranges from $0.10 to $0.35 depending on platform, creator tier, and content format. Instagram CPE for recipe content runs between $0.15 and $0.45, while TikTok CPE averages slightly lower at $0.10 to $0.35. Micro creators consistently deliver lower CPE than macro creators due to higher engagement rates.
How do you calculate cost per engagement?▼
Divide the total campaign cost by the total number of engagements. For example, a $10,000 campaign that generates 50,000 engagements has a CPE of $0.20. Calculate CPE at both the campaign level to measure overall efficiency and at the individual creator level to identify which creators deliver the best engagement performance.
What is the difference between CPE and CPM in influencer marketing?▼
CPM (cost per thousand impressions) measures the cost to reach 1,000 viewers. CPE (cost per engagement) measures the cost to generate one audience interaction like a like, comment, share, or save. CPM tracks awareness efficiency, while CPE tracks engagement efficiency. Both metrics matter, but they measure different outcomes.
Do micro influencers have better CPE than macro influencers?▼
Yes, micro influencers in the 10K-50K follower range consistently deliver lower CPE than macro influencers because their audiences engage at higher rates. Jupiter data shows micro creators deliver 4x-7x higher comment-to-view ratios than macro creators, which translates directly into better cost per engagement for CPG brands.
How can CPG brands optimize cost per engagement?▼
Select creators with strong historical engagement rates, prioritize recipe-focused content over product-only content, and ensure geographic alignment between creator audiences and your retail distribution footprint. Jupiter's 12-signal campaign optimizer evaluates engagement quality, audience credibility, and content recency to recommend creators who deliver the lowest predicted CPE before the campaign launches.
Related Posts
Browse more from our blog.