How CPG Food Brands Use AI to Connect Creator Content to Grocery Sales
A creator posts about your product on Tuesday. Someone buys it at Kroger on Thursday. Standard attribution never connects those two events. Here is how AI does.
Trusted by leading CPG brands

On this page
▼
- The Attribution Gap That Standard Models Cannot Close
- The Three-Layer Attribution Model for CPG Food Brands
- Layer 1: Social Platform Data
- Layer 2: Retail Data (Instacart and Regional Velocity)
- Layer 3: Brand Share of Voice
- Multi-Touch vs Last-Click: Why CPG Needs a Different Model
- Beyond Impressions: The Metrics That Predict Grocery Sales
- Instacart add-to-cart rate by creator
- Save rate on recipe content
- Comment sentiment around purchase intent
- Retailer velocity lift in creator regions
- Share-of-voice delta over the campaign period
- How Jupiter's AI Agent Connects These Signals Without Manual Stitching
AI marketing attribution for CPG food companies is the practice of using artificial intelligence to connect creator content, social engagement, and retail sales data into a single view of campaign performance, without requiring manual data stitching across disconnected platforms. For food and beverage brands selling through grocery retail, standard attribution models built for DTC e-commerce do not work. The purchase happens at Kroger, at Whole Foods, on Instacart. There is no checkout pixel. There is no affiliate link click to close the loop. AI changes that, but not in the way most attribution vendors describe it.
This guide explains the attribution gap specific to grocery CPG, the three-layer model that actually works, what AI adds to each layer, and how brands using Jupiter run it without a data science team.
The Attribution Gap That Standard Models Cannot Close
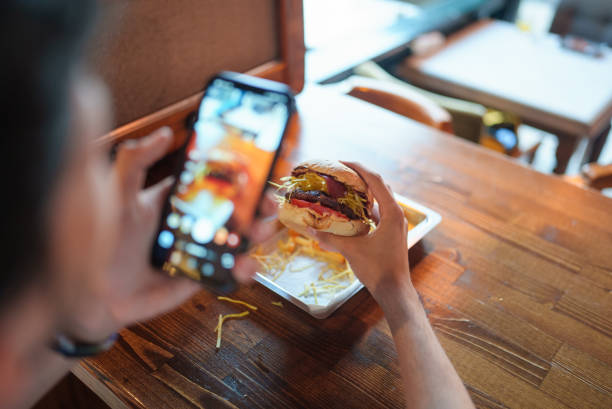
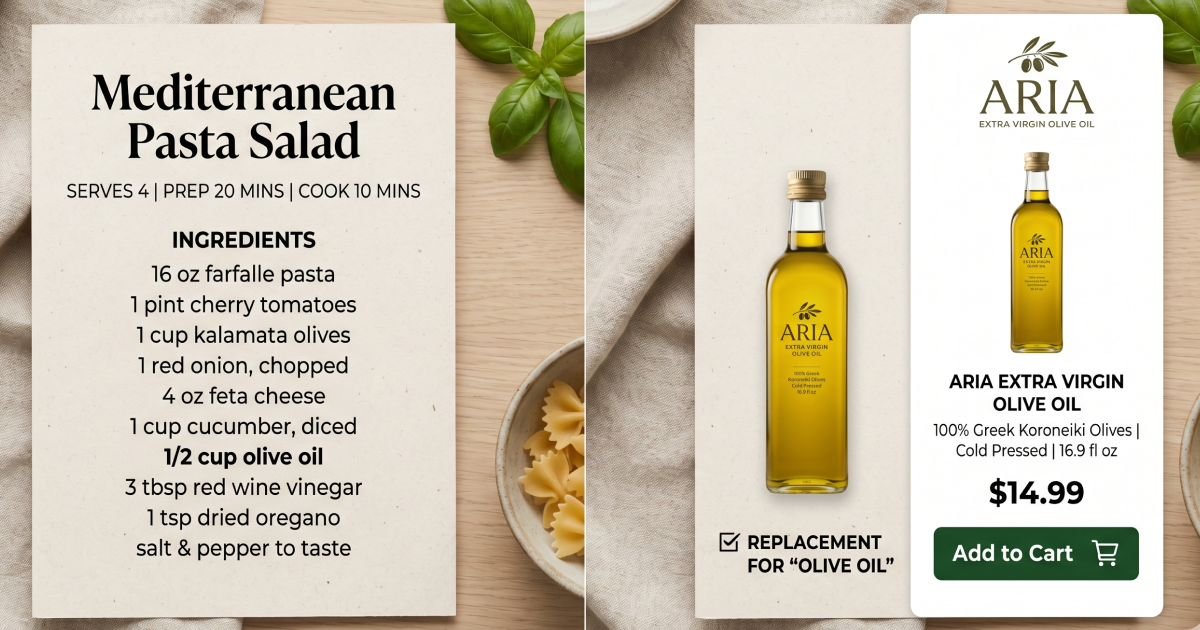
A creator posts a recipe featuring your oat milk on Instagram on Tuesday evening. The post gets 180,000 views and 4,200 saves. By Thursday, your product is restocked at three Kroger locations in Denver. On Saturday, 63 Instacart orders in the Denver metro include your SKU. On the following Monday, your marketing team reports that the campaign delivered 180,000 impressions and moves on.
The connection between Tuesday's post and Saturday's cart was real. Standard attribution recorded none of it.
This is the grocery attribution gap. It is not a technology failure. It is a model mismatch. Last-click attribution was built for DTC brands that own their checkout. When a consumer visits your Shopify store from an influencer link and buys, the chain is complete and measurable. When a consumer sees your product on TikTok and buys it at a Target two days later, there is no link click. There is no pixel event. The impression data and the purchase data live in separate systems that have never spoken to each other.
The brands that have accepted this reality and built three-layer attribution models around it are running more efficient campaigns and making better reinvestment decisions than the brands still waiting for a single-number ROI figure that does not exist in the grocery channel.
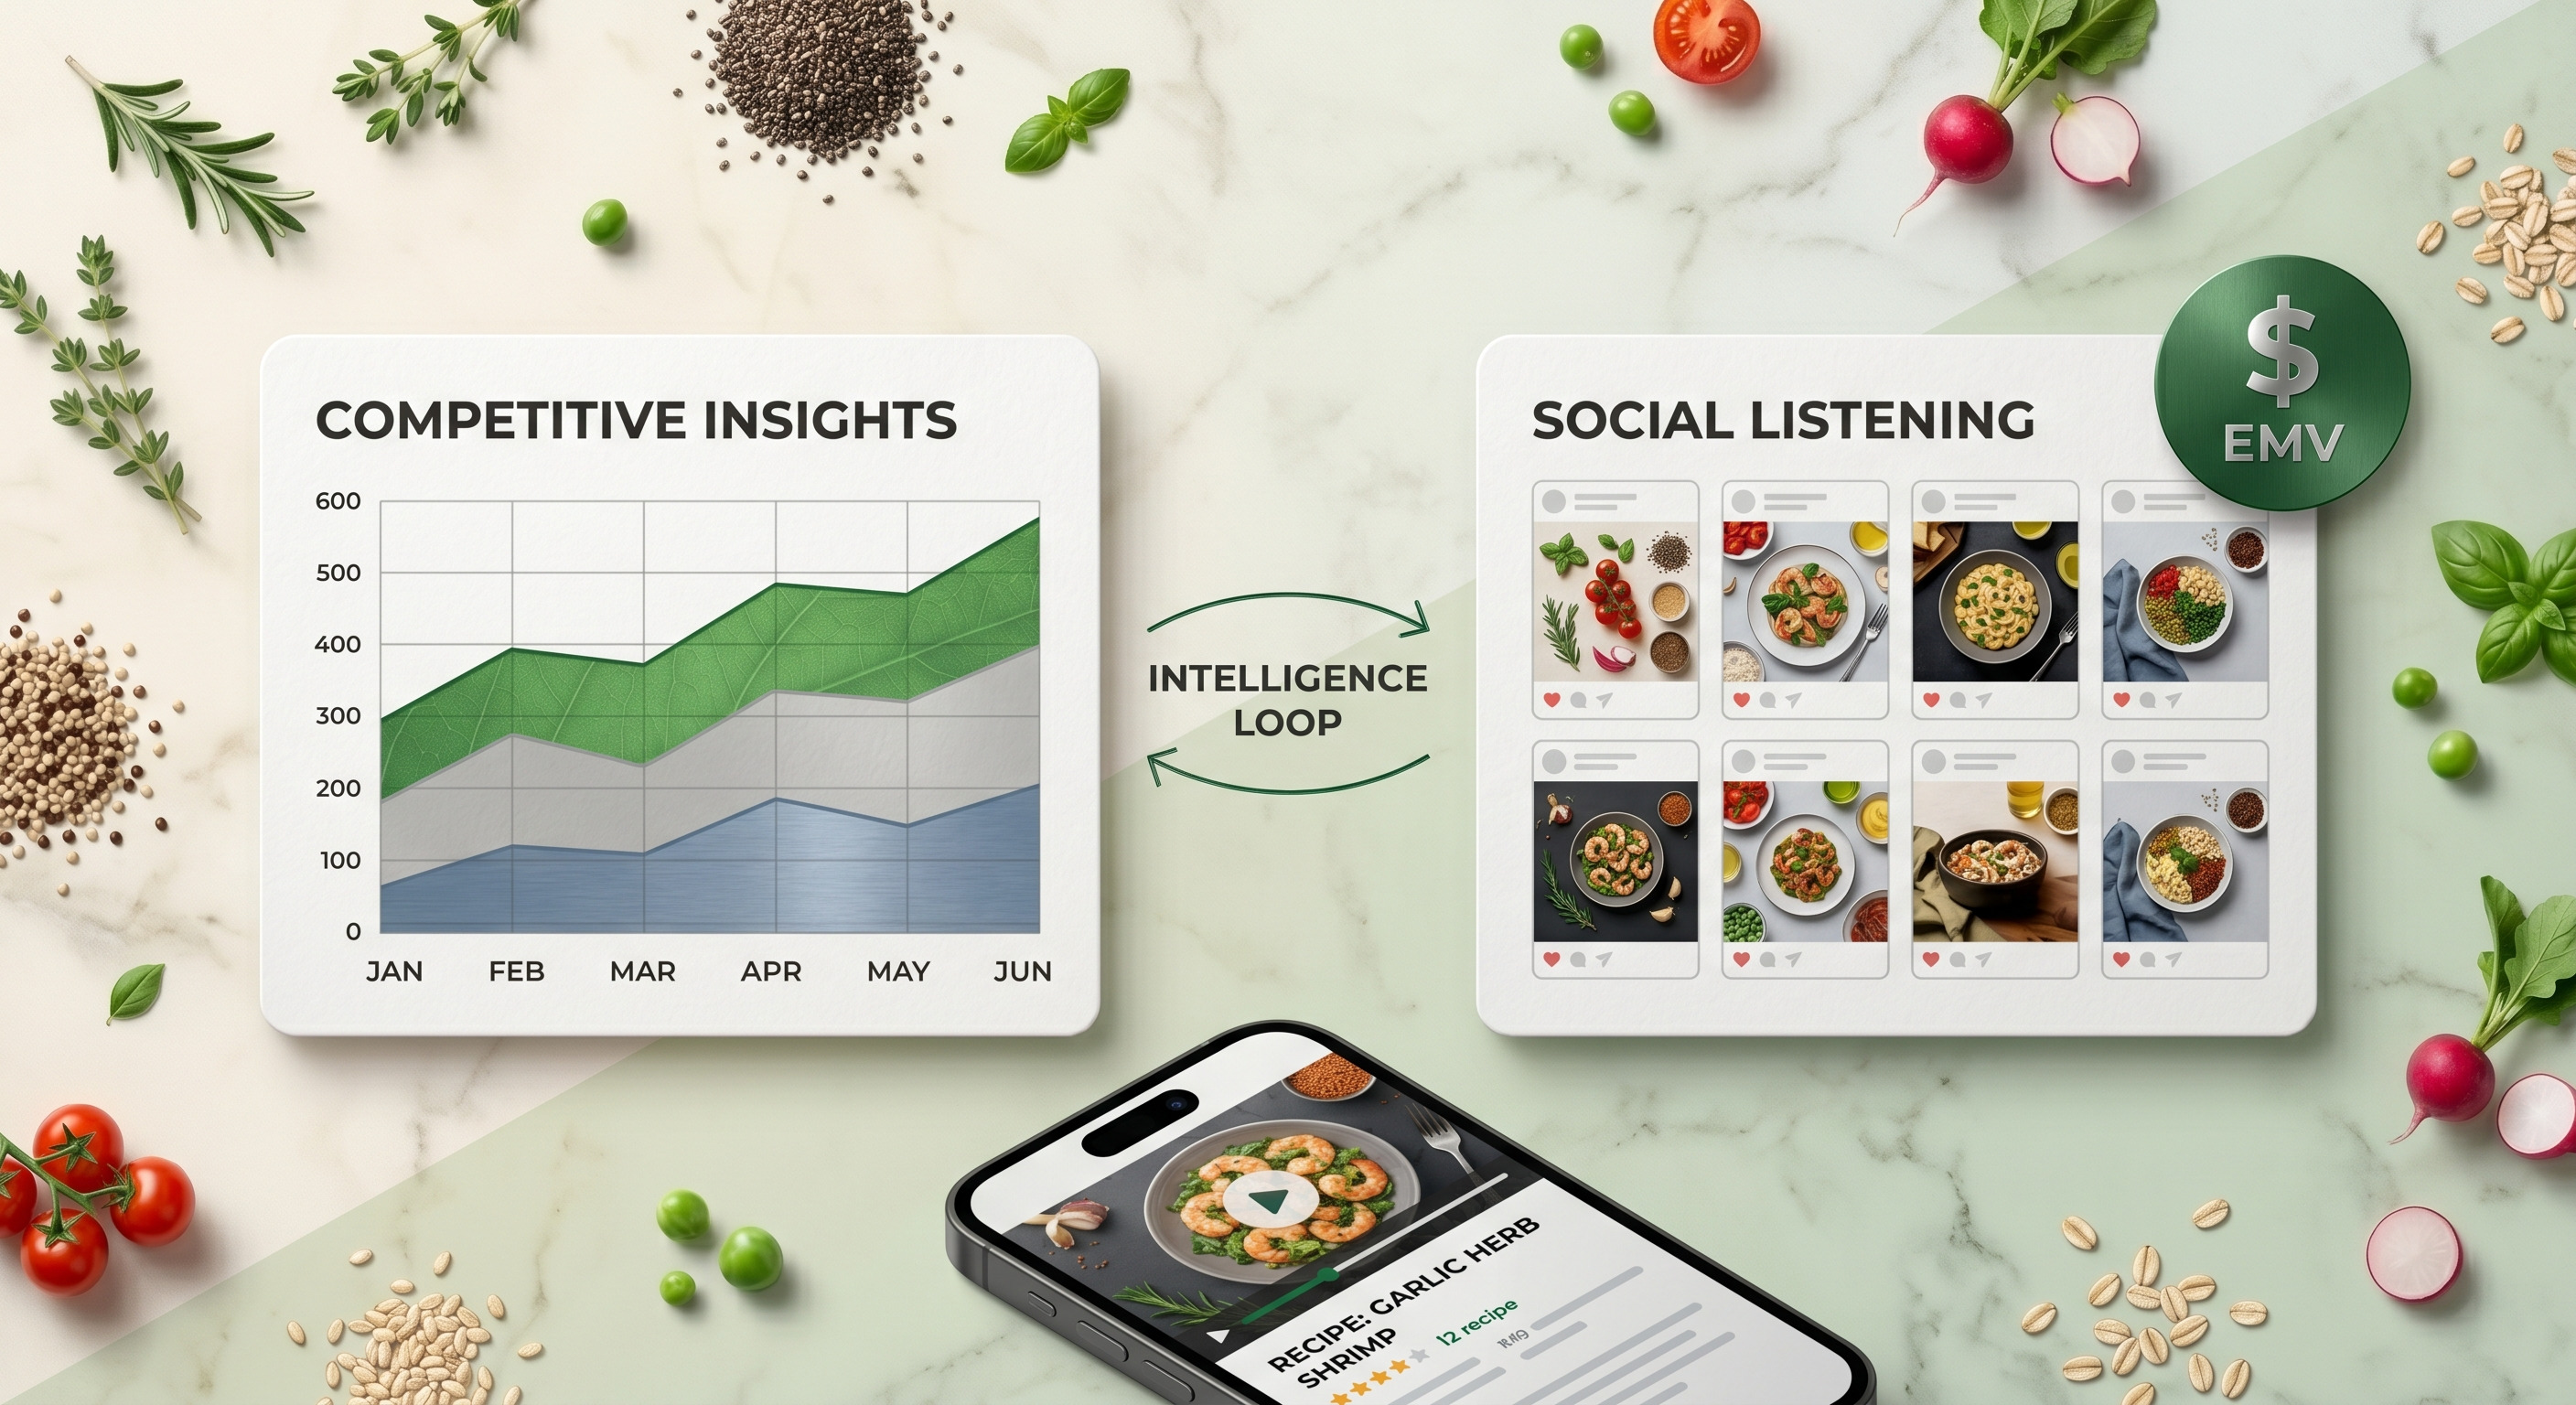
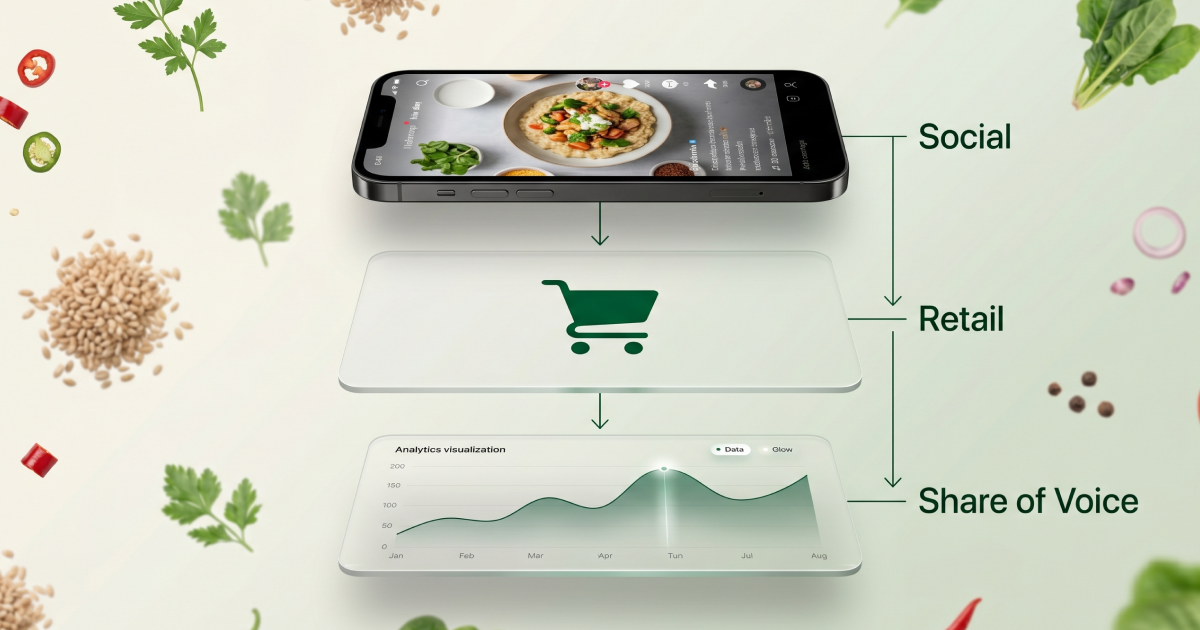
The Three-Layer Attribution Model for CPG Food Brands
AI marketing attribution for grocery CPG works across three layers simultaneously. Each captures a different signal at a different stage of the consumer journey. No single layer tells the full story. Together, they build a picture that is actionable even without a closed-loop purchase signal.
Layer 1: Social Platform Data
This is where attribution starts for most brands and, for most brands, where it also ends. Social platform data covers impressions, video views, saves, comments, shares, and engagement rate per post.
The signal that matters most for grocery CPG is saves. Saves indicate the viewer intends to return to the content, which for recipe posts means they plan to cook the dish and buy the ingredients. A post with 40,000 views and 3,200 saves has a different commercial signal than a post with 40,000 views and 180 saves. Standard reporting treats them identically.
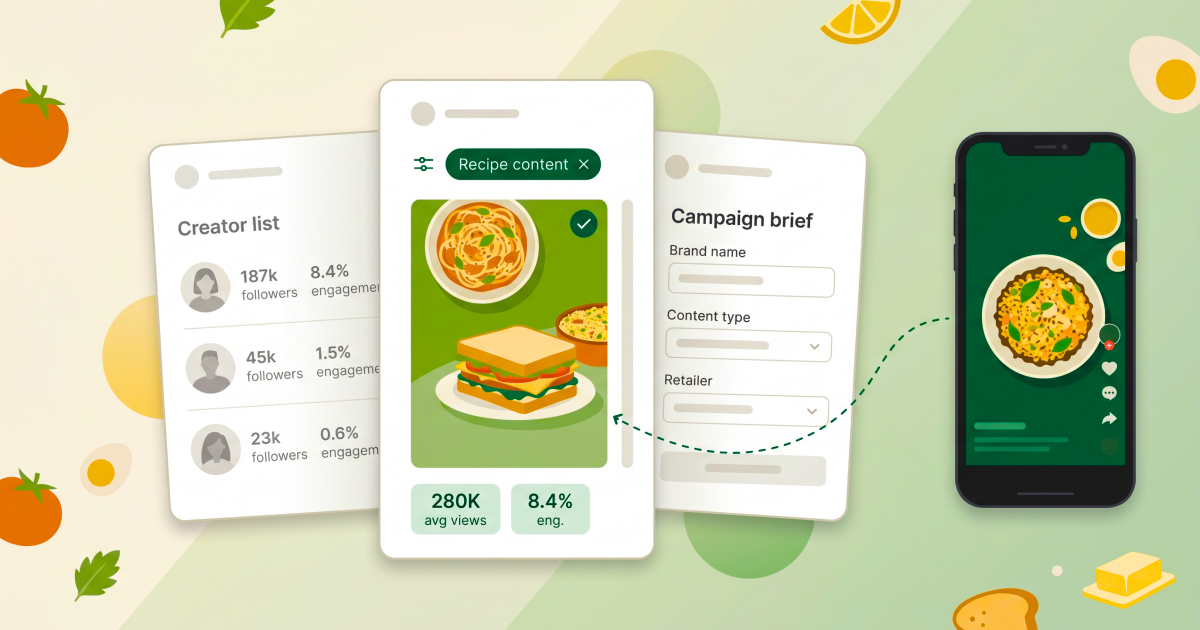
AI adds two things to this layer. First, pattern matching across creators and content types at a scale no human analyst can replicate. AI can scan every post across a 15-creator campaign and identify which content angles (recipe-led vs. product-focused, short hook vs. slow-build, single-product vs. pantry-style) consistently produce higher save rates and comment sentiment associated with purchase intent. Second, anomaly detection. If a creator's post is generating comments at 4 times their historical rate, AI flags it as a signal worth acting on before the window closes, rather than discovering it in a post-campaign report.
Layer 2: Retail Data (Instacart and Regional Velocity)
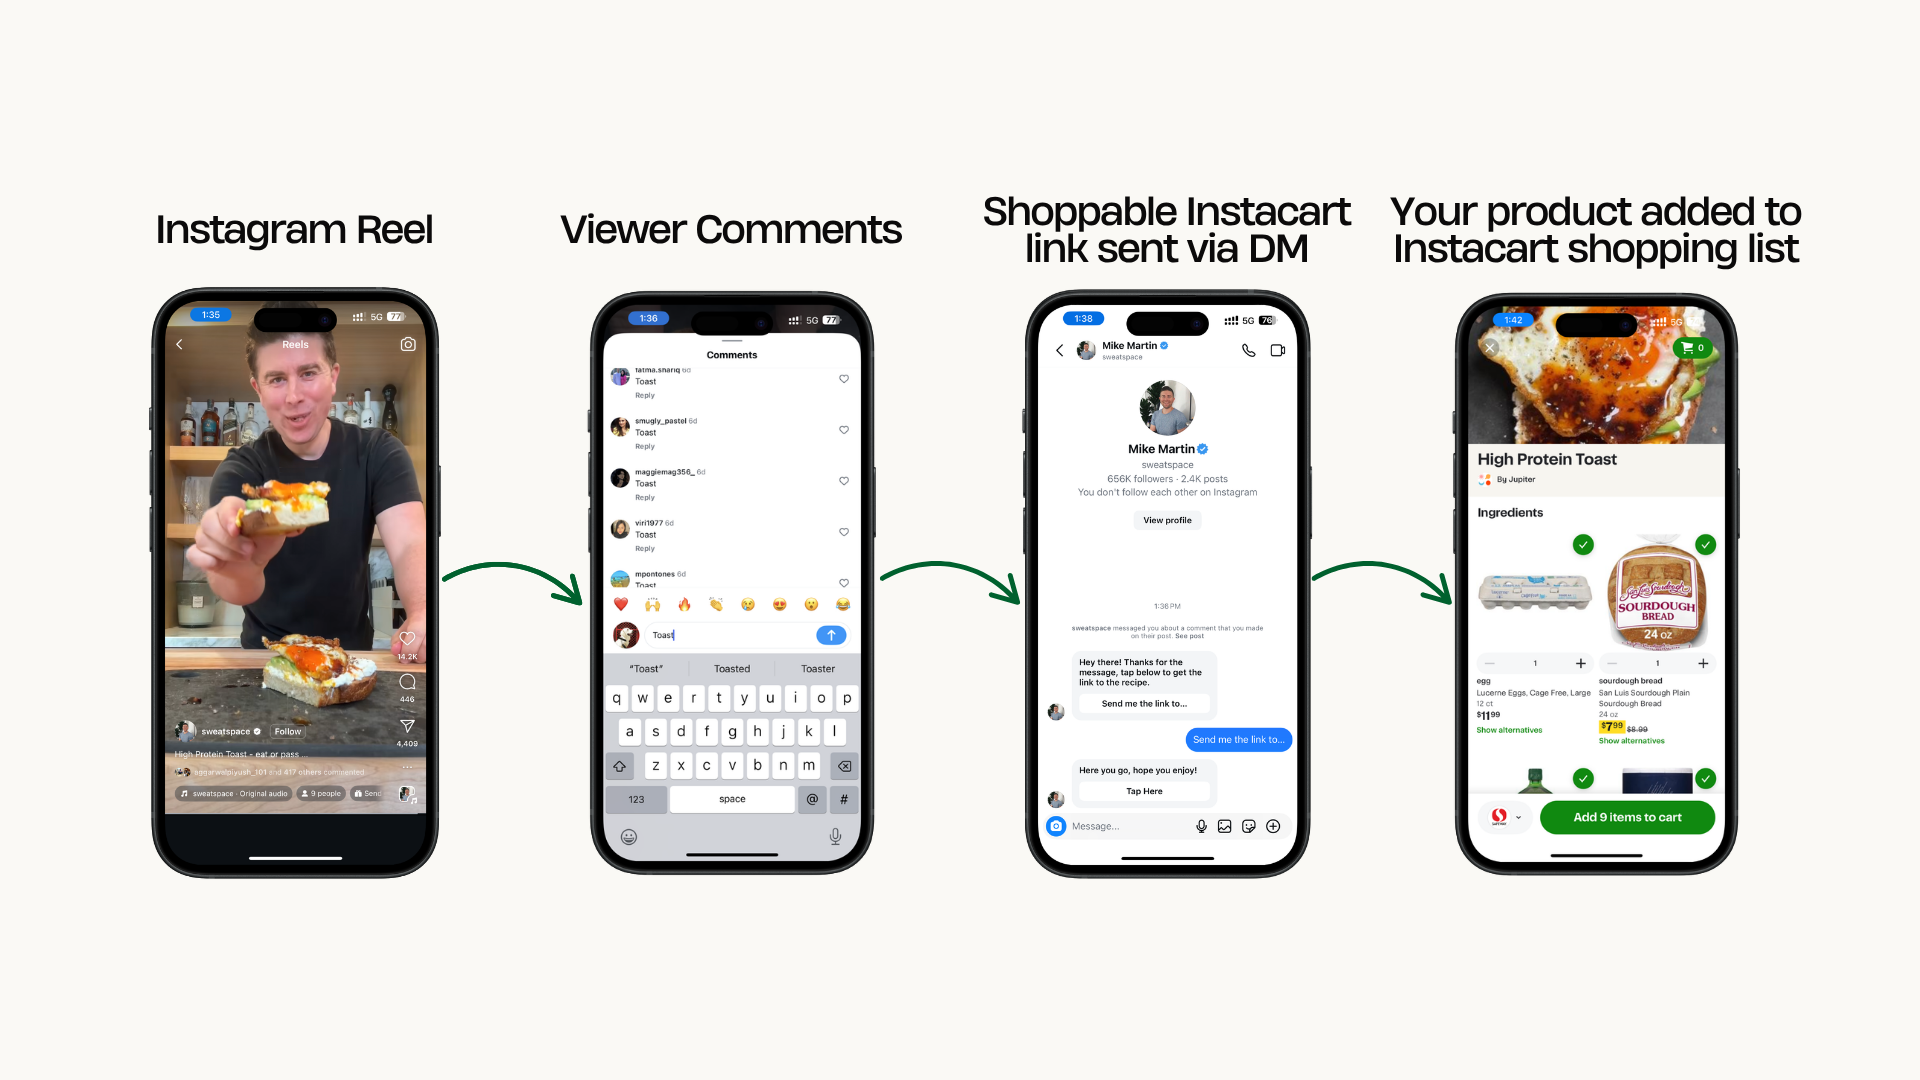
This is the layer that separates grocery attribution from every other attribution model. Instacart shopping list data is the highest-quality purchase-intent signal available to a brand selling through retail, and it is more accessible than most CPG teams realize.
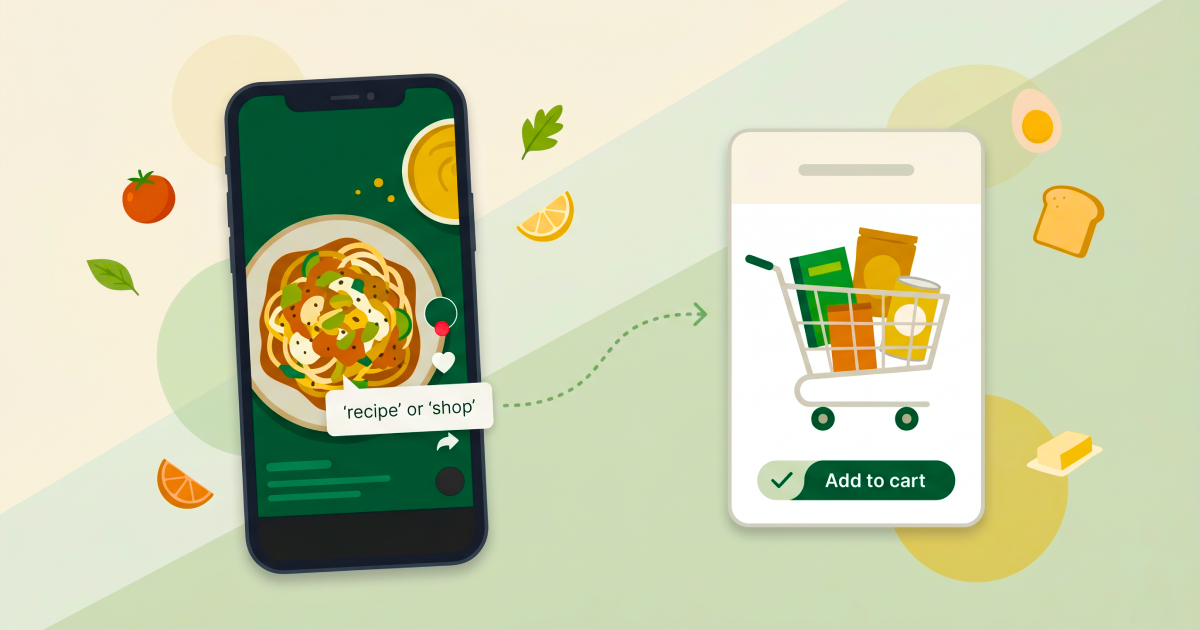
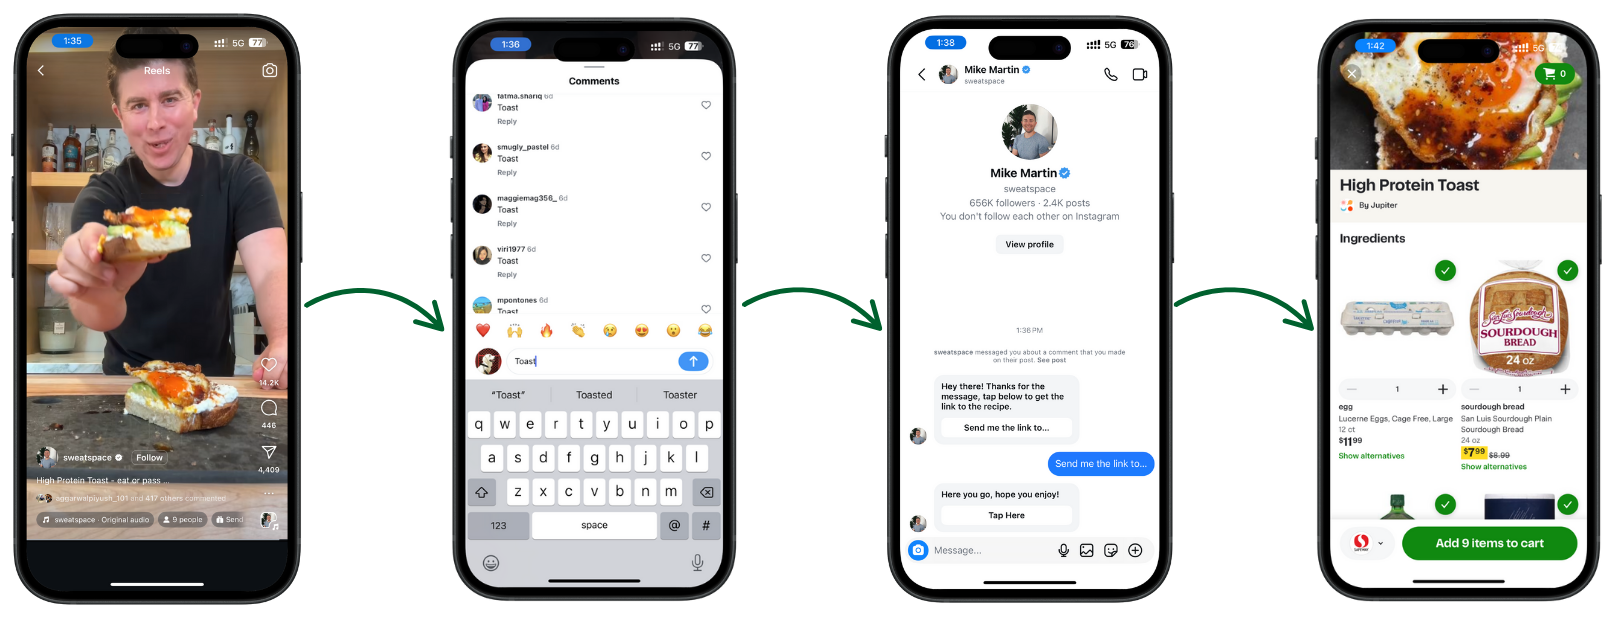
Jupiter's comment-to-cart mechanic closes this layer directly. When a viewer comments on a creator's post with a specific keyword, they automatically receive a DM with a unique shoppable Instacart link tied to that creator and that post. Every shopping list add from that link is tracked back to the originating creator, post, and campaign. A single Instagram Reel running this mechanic drove 6.5 million views and more than 1,000 Instacart cart adds for a Jupiter brand partner. Jupiter is one of Instacart's fastest-growing affiliate partners.
AI adds predictive CPM modeling to this layer. Before a campaign launches, Jupiter's 12-signal optimizer projects expected impressions, cost-per-thousand, and by extension the likely cart-add rate based on historical performance patterns from similar campaigns, creator tiers, content types, and target regions. The projected metrics set a benchmark. During and after the campaign, actual performance is measured against it. The gap between projected and actual, flagged in real time rather than at campaign close, is where AI attribution generates its most actionable signal.
Brands with access to regional scanner data or Instacart sales data can extend this layer further by correlating regional velocity spikes with creator geographic concentration. A campaign weighted toward Denver-area creators followed by an above-average velocity week at Front Range Kroger locations is not coincidence. AI identifies the correlation; the brand's retail team acts on it.
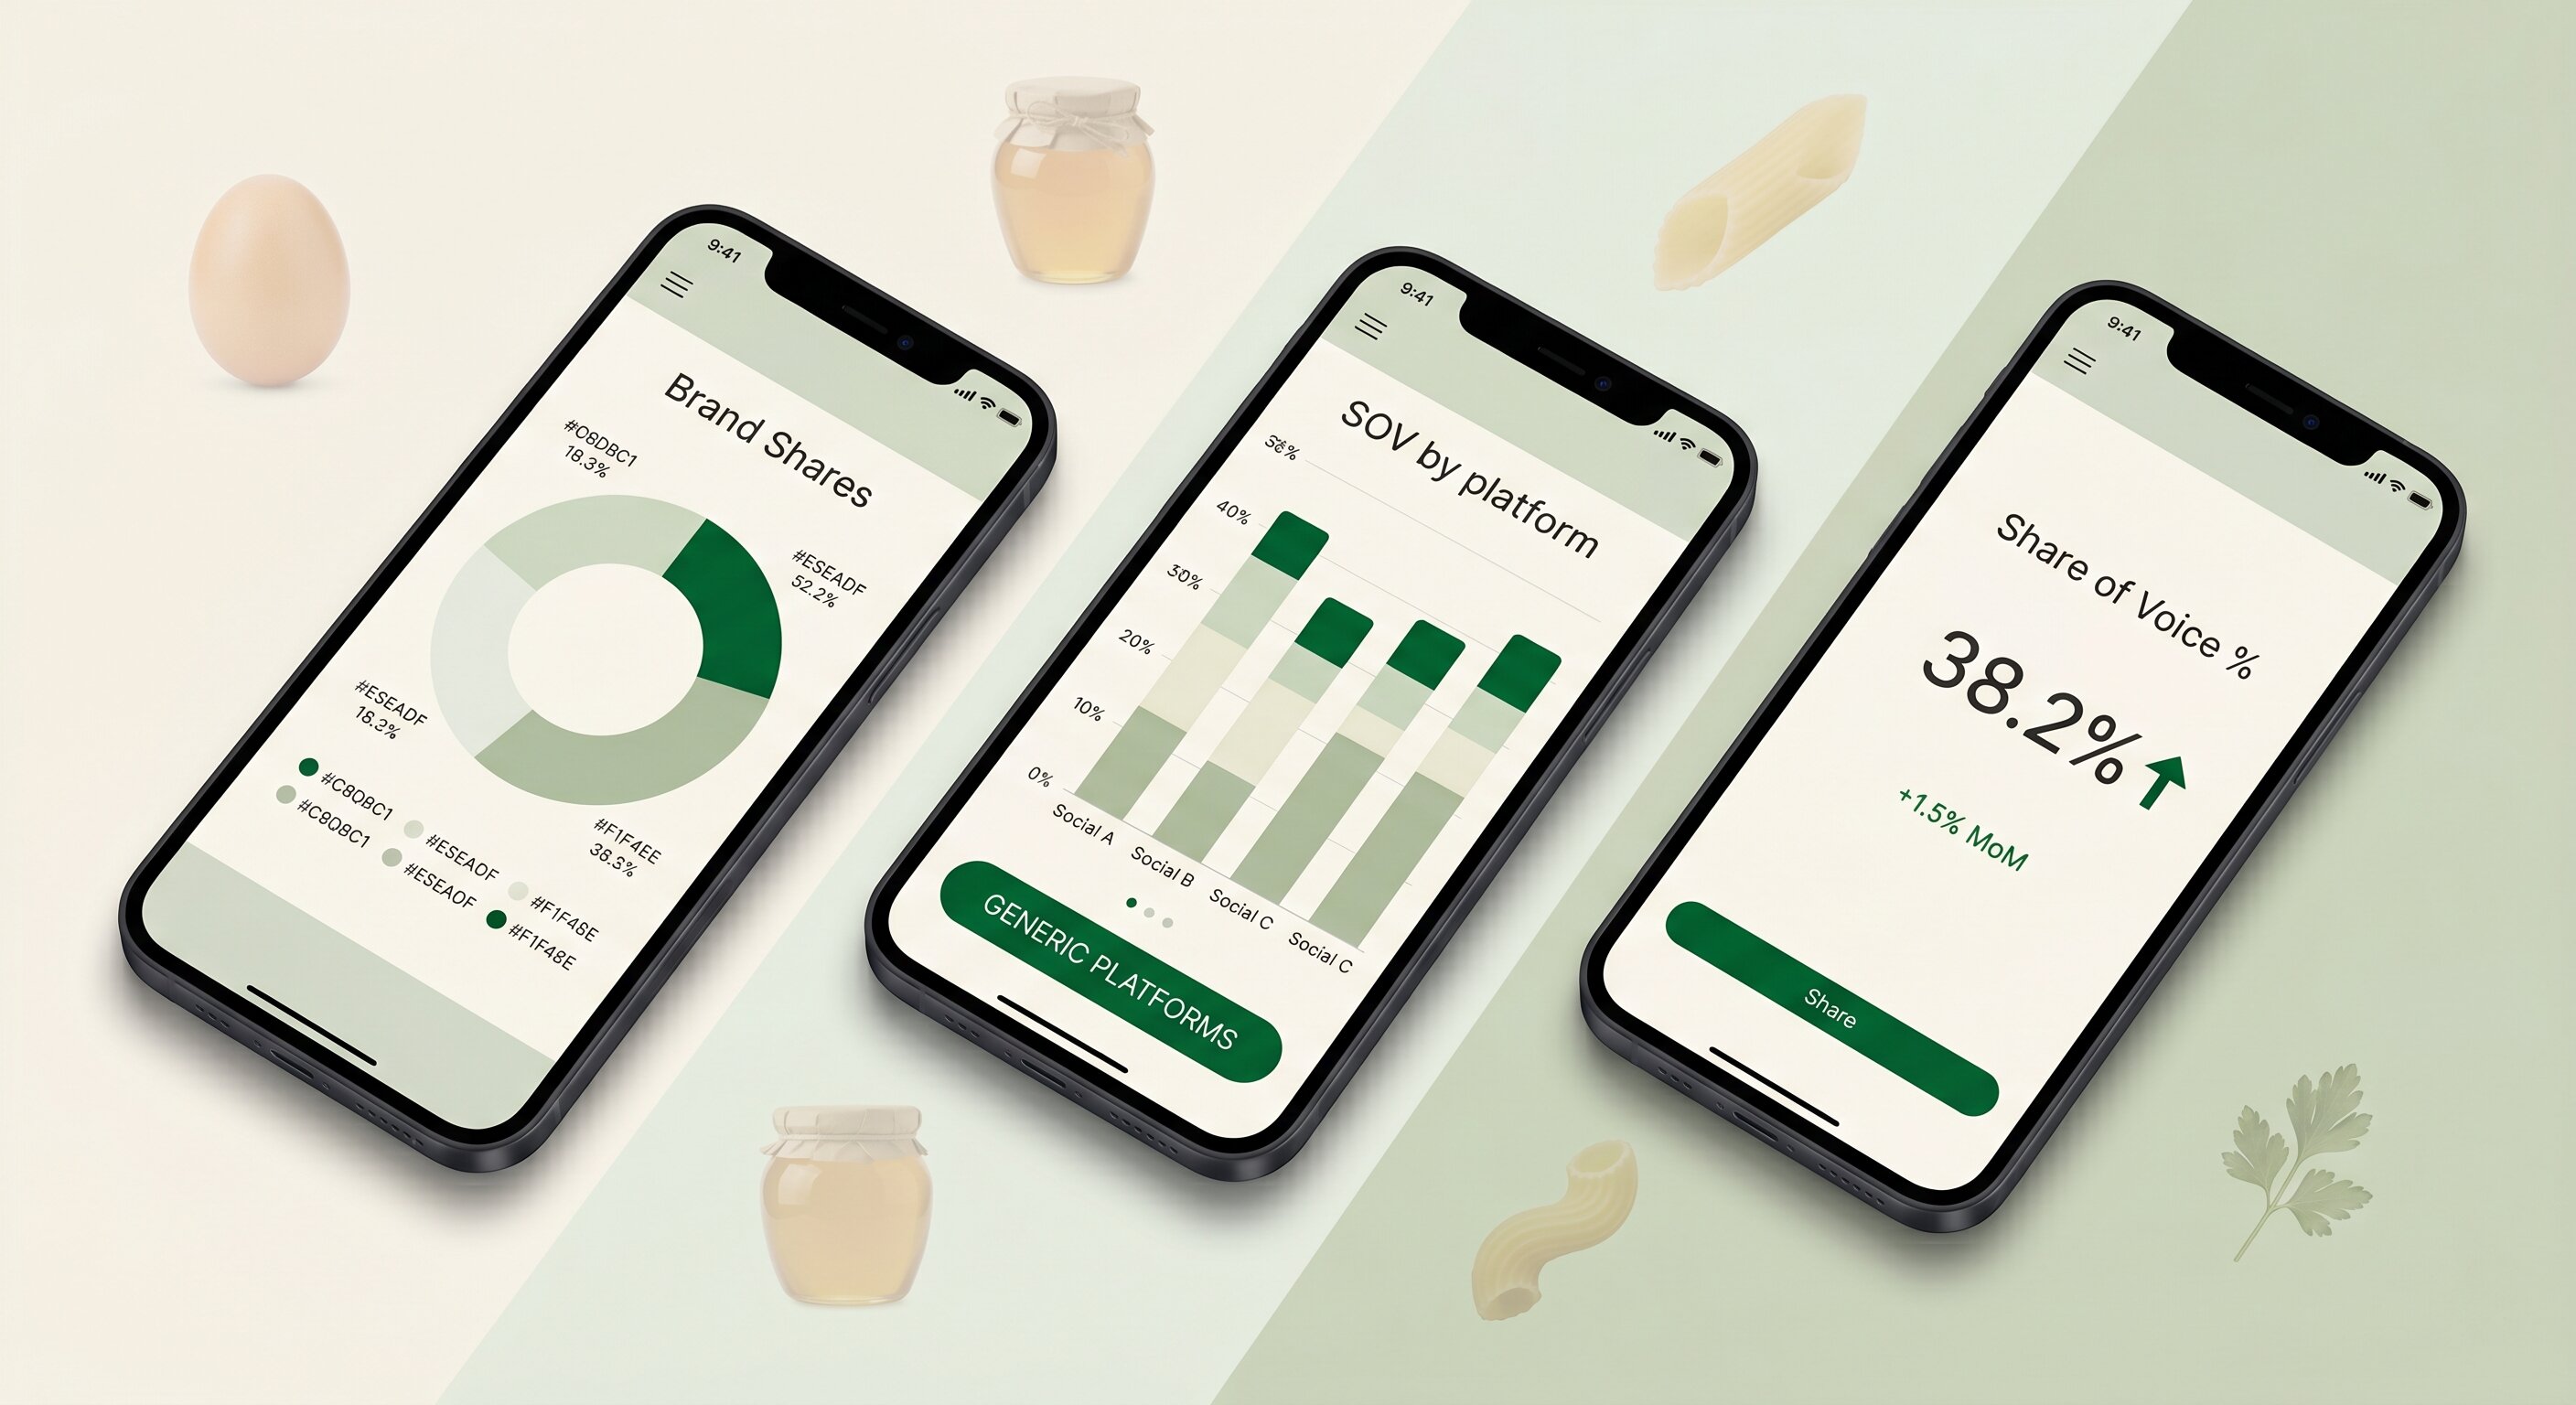
Layer 3: Brand Share of Voice
Share of voice is the attribution layer that almost no CPG brand measures systematically, and the one with the longest commercial lead time. SOV growth predicts retail performance 60 to 90 days in advance more reliably than impressions or engagement rates, because it measures whether your brand is increasing its presence in the total category conversation, not just whether your paid content is delivering views.
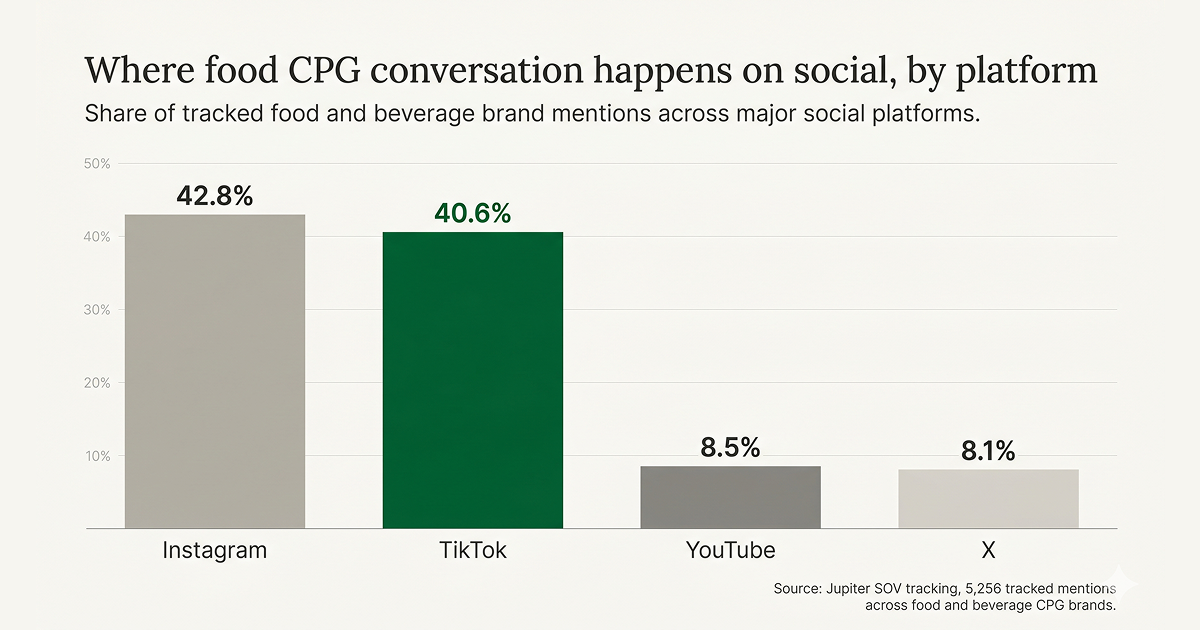
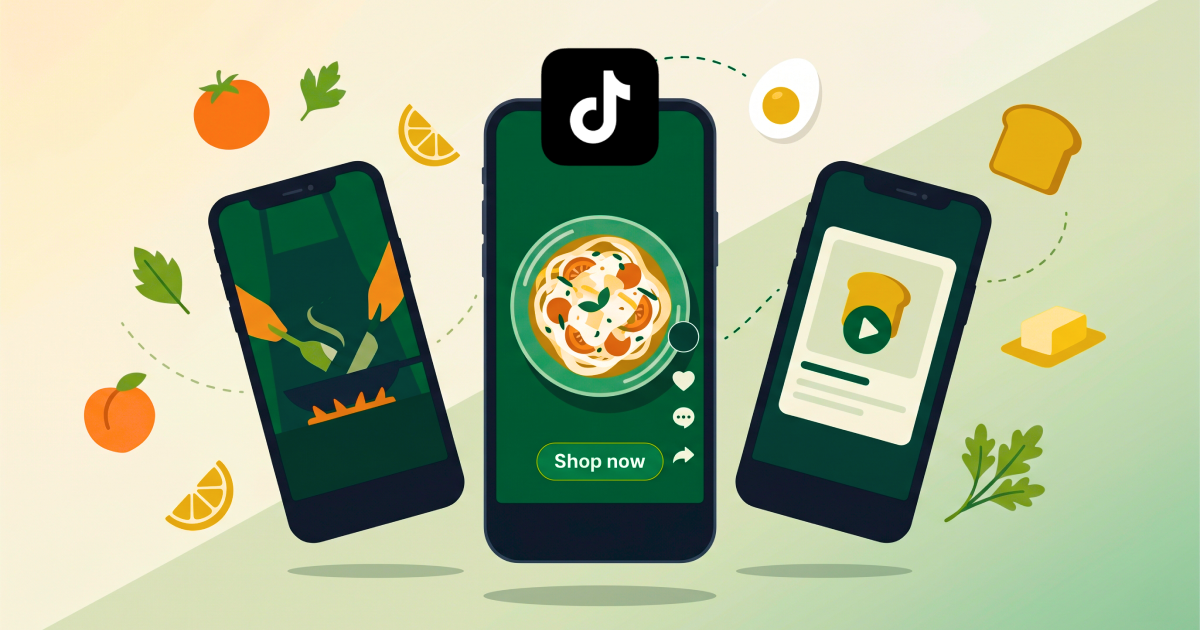
AI adds two things to this layer. First, continuous monitoring across Instagram, TikTok, YouTube, and X simultaneously, surfacing brand mention volume, earned vs. owned split, and competitive SOV percentage in a single view rather than requiring manual quarterly social listening reports. Second, campaign-level correlation. If your SOV percentage climbs from 9% to 14% during a campaign period, AI can identify which campaign activity drove the shift and estimate the contribution of specific creators to the SOV movement.
Jupiter's share of voice tracking runs this continuously. Period-over-period SOV delta is tracked automatically alongside campaign activity, so the connection between creator campaigns and category presence growth is visible without a manual research project.
See Jupiter's three-layer attribution model running across your campaigns
Social platform data, Instacart cart adds, and competitive share of voice, tracked in a single analytics view without manual stitching. Built exclusively for food and beverage CPG brands.
Multi-Touch vs Last-Click: Why CPG Needs a Different Model
Last-click attribution assigns 100% of the credit for a purchase to the final interaction before the sale. For DTC brands, this is a reasonable simplification. For CPG food brands, it is actively misleading.
The grocery purchase journey typically involves three to five exposures before a new product is added to a cart. A consumer might first see your hot sauce in a TikTok creator post. Two weeks later, a different creator uses it in an Instagram recipe. A week after that, they see it in an Instacart search result while restocking their usual condiment. They add it to their cart. Last-click attribution gives 100% of the credit to the Instacart search. The two creator posts that built the familiarity and desirability that made the search result click are invisible in the model.
Multi-touch attribution assigns fractional credit across every touchpoint. It is more accurate and significantly harder to implement. For most CPG marketing teams without a data engineering function, full multi-touch attribution is an aspirational model, not a practical one.
What AI makes practical is a simplified multi-signal model: measuring Layer 1 (social engagement with emphasis on saves and comment sentiment), Layer 2 (Instacart cart adds and regional velocity), and Layer 3 (SOV movement) simultaneously, and using AI to surface correlation patterns across the three without requiring manual data joins. This is not mathematically precise multi-touch attribution. It is a directionally accurate, operationally achievable model that produces better decisions than impressions-only reporting.
Beyond Impressions: The Metrics That Predict Grocery Sales
These are the metrics CPG attribution models should prioritize, in order of their correlation with actual retail outcomes.
Instacart add-to-cart rate by creator
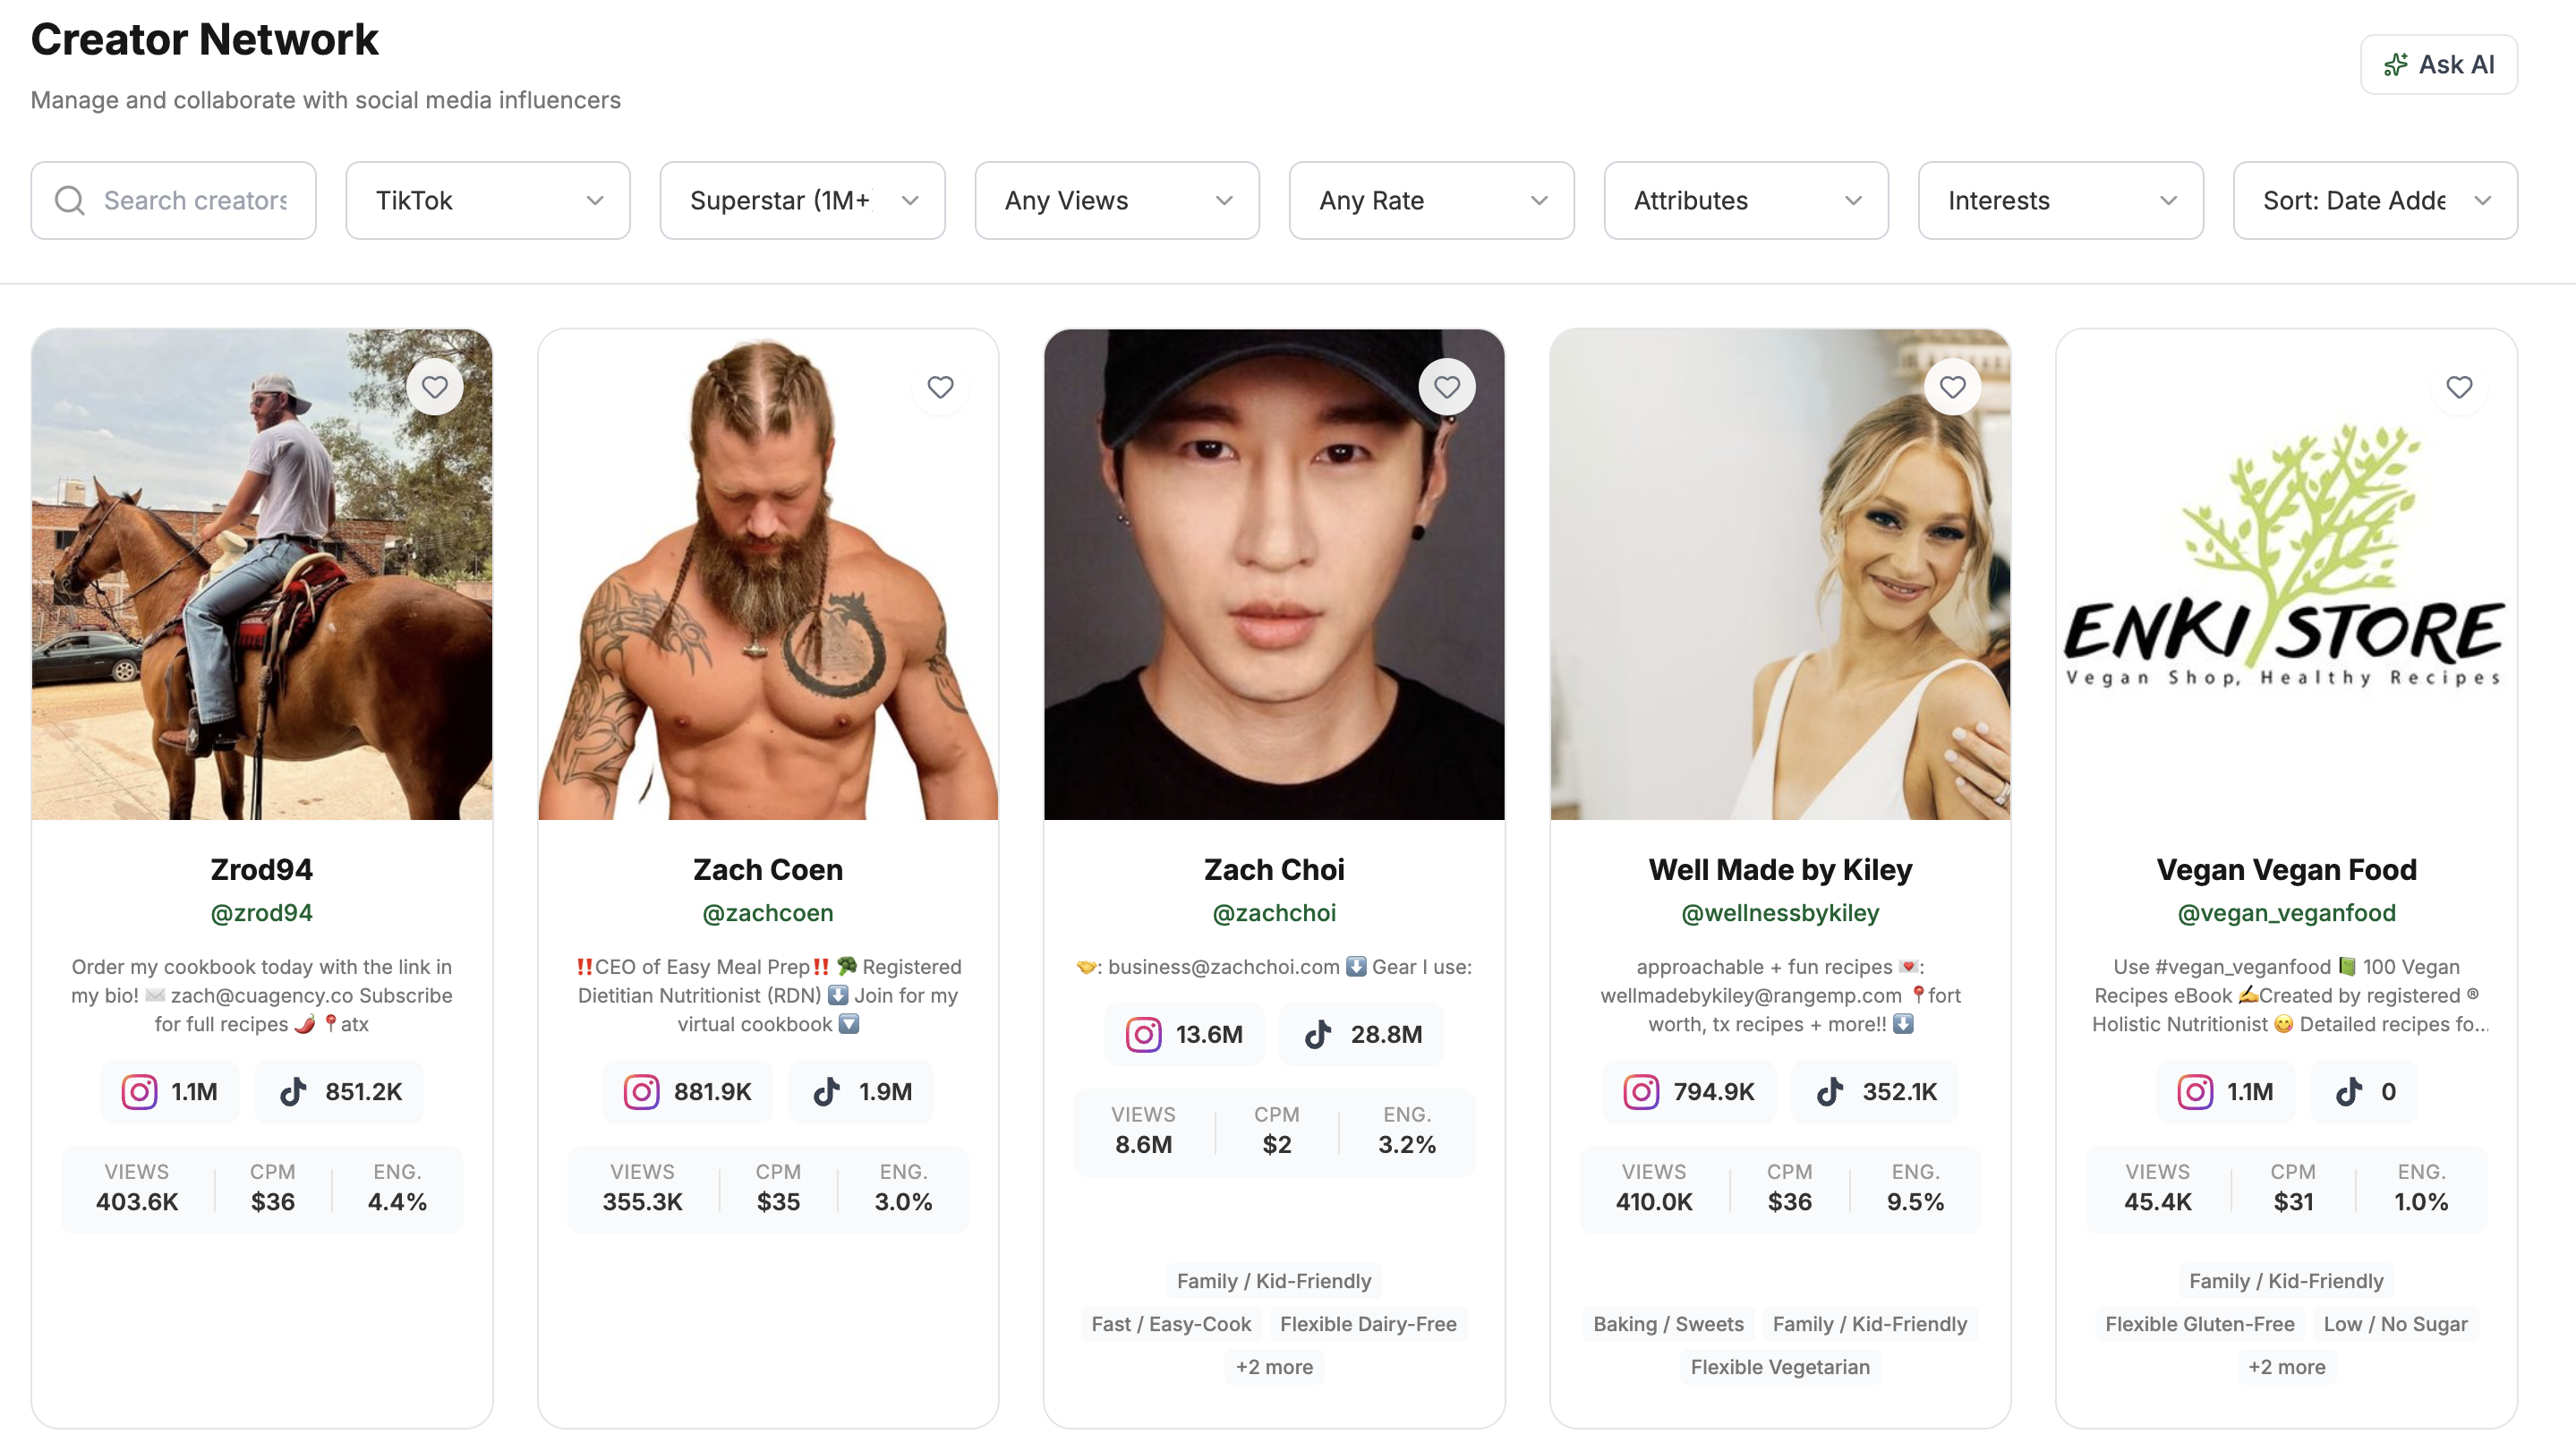
The number of shopping list adds divided by impressions delivered, per creator and per post. This is the signal closest to a conversion event available in the grocery channel. Creators who consistently drive high add-to-cart rates relative to their impression delivery are disproportionately valuable and should be prioritized for rebooking and increased investment.
Save rate on recipe content
Saves divided by video views or reach, by content type. Save rate above 2% on food content indicates strong purchase intent. Track it at the creator level to identify which content angles convert, not just which ones entertain.
Comment sentiment around purchase intent
Comments containing phrases like "adding this to my cart," "need to try this," and "where do I buy this" are commercial signals. AI scans comment content at volume and surfaces creators whose audiences are responding with intent language rather than generic positive engagement.
Retailer velocity lift in creator regions
Velocity index (unit sales velocity vs. category average) in the geographic markets where your creators are concentrated, measured during and immediately after campaign periods. This requires retail data access, but for brands that have it, regional velocity correlation is the strongest available evidence of creator-driven sales impact.
Share-of-voice delta over the campaign period
SOV percentage at campaign start vs. end. A campaign that delivers strong impressions but no SOV movement is delivering reach without compounding brand presence. A campaign that delivers moderate impressions but meaningful SOV growth is building long-run category position.
Still reporting your CPG campaigns on impressions and engagement rate alone? There is a more complete model.
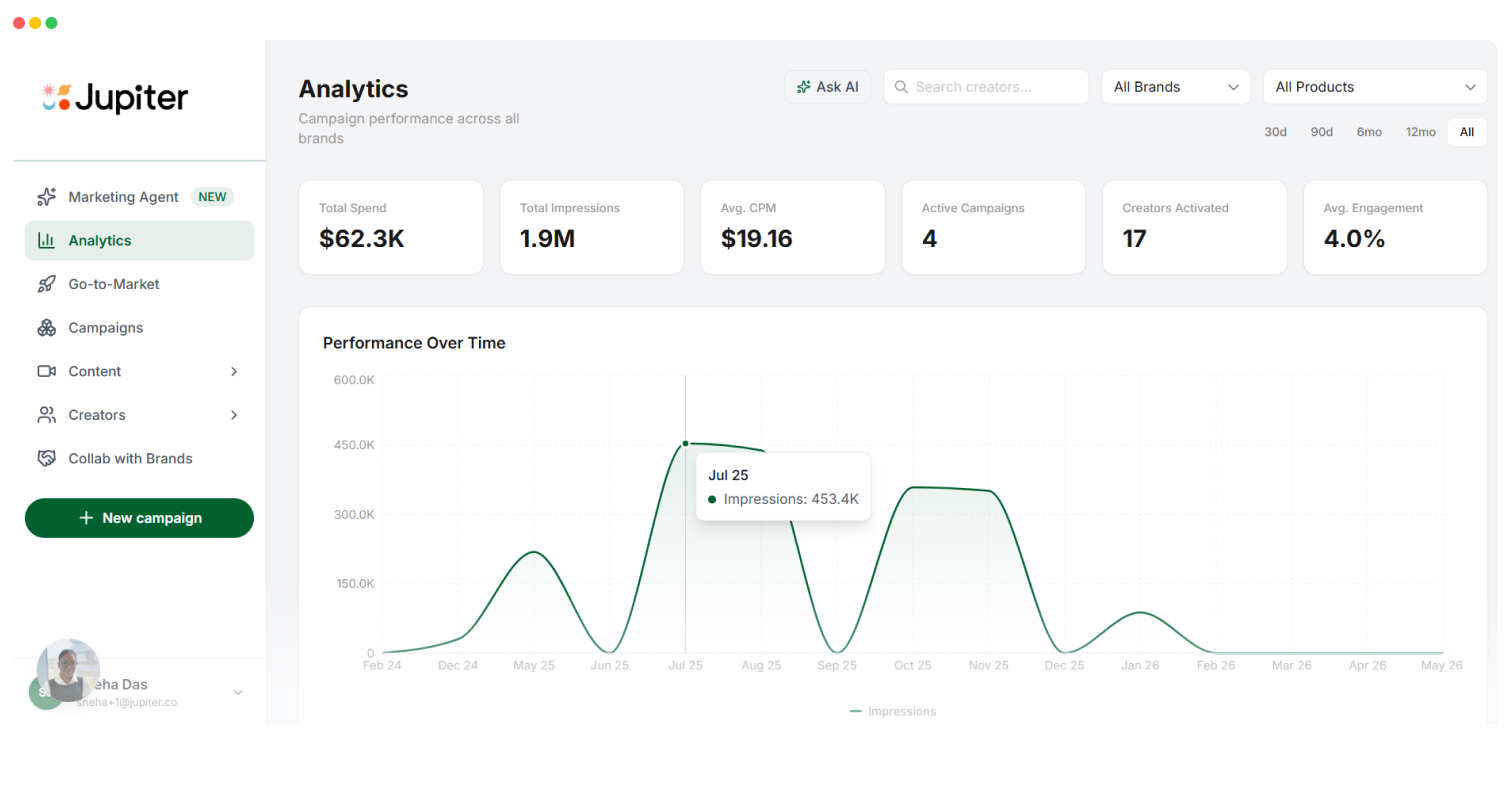
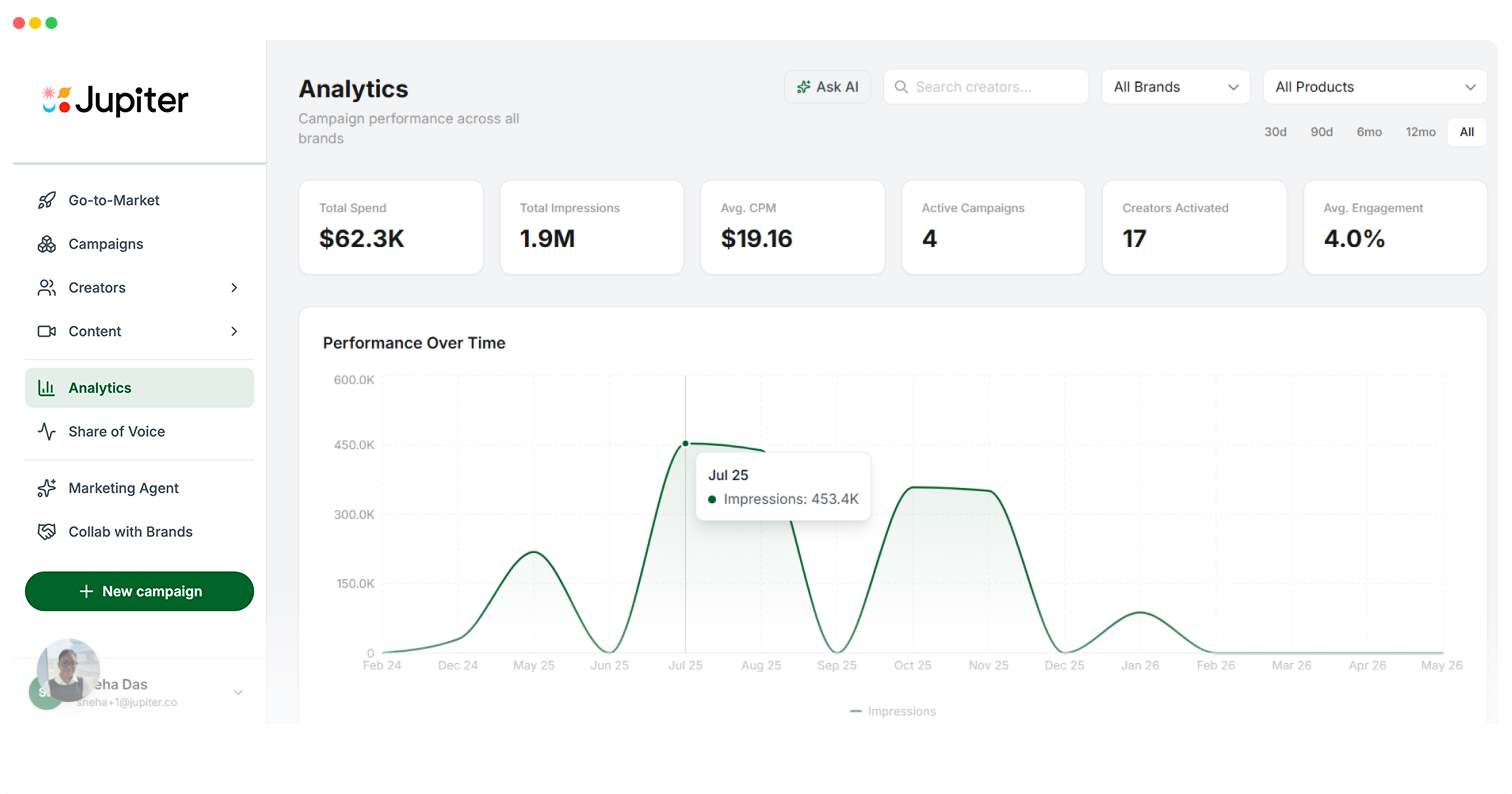
Jupiter's analytics dashboard tracks Instacart cart adds, creator cost efficiency, campaign health against projections, and SOV movement across every campaign automatically.
How Jupiter's AI Agent Connects These Signals Without Manual Stitching
The operational challenge of multi-layer attribution is not conceptual. It is practical. Social data, Instacart data, and SOV data live in different systems. Connecting them manually requires pulling reports from three sources, building a reconciliation in a spreadsheet, and repeating the process every week. Most CPG teams do it once per campaign cycle, if at all.
Jupiter's AI marketing agent, built on 20 specialized tools, removes the manual stitching requirement. The agent pulls social performance data, Instacart cart-add attribution, campaign health scores, creator leaderboard data, and SOV movement from a single conversational interface. A marketing manager can type "which creators drove the most Instacart adds last month" or "how does our SOV compare to our campaign spend over the last 90 days" and receive a synthesized answer without opening four separate platforms.
The analytics dashboard surfaces the same data visually: estimated vs. actual impressions and CPM per campaign, campaign health status at green (delivering 80% or more of projected impressions), yellow (50 to 80%), or red (below 50%), creator leaderboard ranked by impressions and cost efficiency, and SOV delta tracked period-over-period alongside campaign activity.
Jupiter's 12-signal optimizer closes the predictive loop. Before every campaign launches, it projects impressions, CPM, and expected performance across 12 signals including content interest alignment, posting recency, retailer proximity, brand affinity from past collaboration history, creator attribute match, audience attribute match, engagement quality, view consistency, audience credibility, audience demographics, hashtag relevance, and geographic distribution. Post-campaign actuals are then measured against those projections. The gap between predicted and actual, visible in real time, is where attribution becomes decision-making: which creators to rebook, which content angles to scale, which regions to prioritize.
For a deeper breakdown of how the four-layer attribution framework connects to Instacart specifically, the Jupiter Instacart influencer marketing playbook covers the mechanic and measurement in full.
Brands including Banza, Pete & Gerry's, Kettle & Fire, and Bonafide Provisions use Jupiter to run attribution across all three layers, connecting creator content to grocery purchase intent through Instacart, without a data engineering team or a third-party analytics integration.
Attribution built for the grocery purchase journey, not the DTC checkout.
Jupiter tracks Instacart cart adds, creator cost efficiency, campaign health, and competitive share of voice across every campaign, automatically. Used by 58+ food and beverage CPG brands including Banza, Pete & Gerry's, and Kettle & Fire.
FAQs
Quick answers to common questions.
What is AI marketing attribution for CPG food companies?▼
AI marketing attribution for CPG food companies is the use of artificial intelligence to connect creator content performance, Instacart shopping list data, and social share-of-voice signals into a single view of campaign performance, without manual data stitching. Because CPG food brands sell through grocery retail rather than a brand-owned checkout, standard last-click attribution models cannot capture the purchase behavior that creator campaigns drive. AI attribution builds a three-layer model across social data, retail data, and brand share of voice to produce directionally accurate performance signals even without a closed purchase loop.
What is the most reliable attribution method for CPG influencer marketing?▼
The most reliable attribution method for CPG influencer marketing combines Instacart shopping list attribution (via a comment-to-DM mechanic that ties cart adds to specific creator posts), creator-level save rate and comment-intent analysis from social platform data, and share-of-voice movement tracked before, during, and after each campaign. No single method captures the full picture, because the grocery purchase journey involves multiple touchpoints before a product is added to a cart. Combining all three layers gives CPG marketing teams the most complete actionable signal available.
How do you track influencer marketing ROI for a food brand without a DTC checkout?▼
Tracking influencer marketing ROI for a grocery food brand without a DTC checkout runs through four metrics: Instacart add-to-cart rate by creator and post (using comment-triggered DM links), creator cost efficiency measured as impressions per dollar, campaign health tracked as actual vs. projected impressions and CPM, and share-of-voice delta over the campaign period. Brands with access to scanner data or Instacart regional sales data can also correlate regional velocity spikes with creator geographic concentration during campaign periods.
Can AI attribution work at the individual creator level?▼
Yes. At the creator level, AI attribution surfaces Instacart cart-add rate per creator, save rate and comment-intent language per post, impressions per dollar across the campaign period, and actual vs. projected performance against pre-campaign benchmarks. The combination of these signals at the individual creator level is what tells a CPG brand manager which creators to rebook, which to increase investment in, and which to replace in the next campaign cycle, without relying solely on vanity engagement metrics.
How does in-store attribution work for influencer marketing campaigns?▼
In-store attribution for influencer marketing is the most difficult layer to close without retailer data partnerships. The most accessible proxy is regional velocity analysis: tracking unit sales velocity (units per store per week vs. category average) in the geographic markets where your campaign creators are concentrated, during and immediately after campaign periods. Brands using Jupiter can combine regional creator concentration data from the campaign optimizer with scanner data from their retail partners to identify geographic velocity correlations. This is directional, not precise, but it is the most practical in-store attribution method available without a direct retail data integration.
What does Jupiter's AI do for CPG marketing attribution specifically?▼
Jupiter's AI Marketing Agent, built on 20 specialized tools, connects social performance data, Instacart cart-add attribution, campaign health scores, creator leaderboard rankings, and competitive share-of-voice data in a single conversational interface. It eliminates the manual reporting process of pulling data from separate platforms and gives CPG marketing managers synthesized attribution answers in plain language. The Jupiter analytics dashboard surfaces estimated vs. actual impressions and CPM, campaign health at the green/yellow/red level, creator cost efficiency, and SOV movement automatically, updated continuously across all active campaigns.
Related Posts
Browse more from our blog.