Share of Voice Tracking for CPG Brands: A Data-Driven Competitive Guide
Share of voice tells food CPG brands whether their category conversation is growing or shrinking relative to competitors. This guide covers the formula, the metrics that matter, and how modern platforms automate what used to take weeks.
Trusted by leading CPG brands
On this page
▼
- Share of Voice Is a Relative Metric, Not an Absolute One
- Building a Competitive Set for a Food CPG Category
- Category specificity
- Platform-specific handles and keywords
- Owned vs. earned classification
- The Four SOV Metrics CPG Brands Actually Use
- 1. Mention SOV %
- 2. Engagement SOV %
- 3. Owned vs. Earned Split
- 4. Platform Breakdown
- Why Quarterly SOV Reports Are Not Enough
- Connecting SOV to Influencer Campaign Performance
- Four Decisions SOV Data Makes Easier
- Budget reallocation between platforms
- Identifying competitive surges before they become problems
- Benchmarking influencer investment
- Finding platform-specific gaps
- How Jupiter Handles SOV Tracking for Food CPG Brands
Share of voice (SOV) is the percentage of total social mentions in a product category that belong to a specific brand. For CPG advertising teams, it answers the question that raw impression counts cannot: are we actually gaining ground against competitors, or just spending more to stay in place?
A brand can run a successful quarter by its own internal benchmarks and still be losing share of voice to a faster-growing competitor. SOV catches that before it shows up in retail scan data.
This guide covers how CPG brands calculate share of voice, what a competitive set actually looks like in a food category, which metrics to prioritize, and how platforms like Jupiter automate the process from brand setup onward.
Share of Voice Is a Relative Metric, Not an Absolute One
This distinction matters more in CPG advertising than almost any other category. Food and beverage is one of the most crowded social media verticals. Egg brands, pasta brands, honey brands, plant-based protein brands: every category has three to eight serious competitors running creator campaigns simultaneously on Instagram and TikTok.
The SOV formula is simple:
If your pasta brand generated 1,200 social mentions in a 30-day period, and the total conversation across your category (your brand plus all direct competitors) was 5,000 mentions, your SOV is 24%.
What makes this number meaningful is the delta. A 24% SOV that was 18% three months ago is a strong signal. A 24% SOV that was 31% three months ago is a warning. Neither reading is available from your own campaign impressions data alone.
Period-over-period delta is how CPG marketing teams use SOV operationally, not just for reporting. The formula is straightforward:
A positive delta means your share of the category conversation is growing. A negative delta means a competitor is growing faster than you, even if your absolute mention counts are rising.
Building a Competitive Set for a Food CPG Category
The first practical challenge with SOV tracking is defining the competitive set correctly. For CPG brands, this means identifying four to six direct competitors in the same grocery category, not broad industry peers.
A pasture-raised egg brand competes against other pasture-raised and free-range egg brands at retail: Vital Farms, Happy Egg Co., Eggland's Best, Organic Valley. It does not compete in any meaningful SOV sense with a plant-based protein brand, even if both appear in the same health food aisle.
Getting the competitive set right requires three things:
Category specificity
The set should reflect how a shopper actually chooses between brands at the shelf or on Instacart. For a honey brand like Sue Bee, the relevant competitors are Nate's Honey, Local Hive, Mike's Honey, and Busy Bee, not all sweeteners.
Platform-specific handles and keywords
Each competitor needs its own tracking terms: brand keywords, product hashtags, and owned social handles (Instagram, TikTok, YouTube, X). Without this, mention data is noisy and incomplete.
Owned vs. earned classification
A CPG brand's own posts are fundamentally different from creator-generated or consumer-generated mentions. Tracking them together without separation makes it impossible to measure influencer program effectiveness.
Jupiter's SOV system, running across 38 active CPG categories today, uses AI to derive the competitive set automatically when a brand is added to the platform. The system identifies the grocery category, discovers four to six direct competitors, and configures the tracking terms: keywords, hashtags, and handles per platform. From that point, data collection runs weekly with no manual setup required.
Real competitive sets currently running in production include Pete & Gerry's against Vital Farms, Happy Egg Co., Eggland's Best, Organic Valley, and Nellie's Free Range Eggs; Banza against Barilla, Tolerant, Explore Cuisine, Ancient Harvest, and Chickapea; and Sue Bee Honey against Nate's Honey, Local Hive, Mike's Honey, and Busy Bee Honey. These are not hypothetical examples. They are live SOV categories with active weekly data collection across Instagram and TikTok.
The Four SOV Metrics CPG Brands Actually Use
Not all share of voice data is equally useful for CPG advertising decisions. These four metrics drive the most action.
1. Mention SOV %
The primary metric. Your brand's share of total category social mentions. Track it at 7-day, 30-day, and 90-day windows. The 7-day view catches campaign surges; the 90-day view reveals structural share shifts.
2. Engagement SOV %
Mention volume does not always reflect actual attention. A competitor with fewer mentions but higher-engagement content is building a stronger audience relationship. Engagement SOV accounts for this:
For CPG brands running influencer programs, this metric is particularly revealing. A creator campaign that drives high engagement on your owned content will move engagement SOV faster than it moves mention SOV.
3. Owned vs. Earned Split
Owned mentions are posts from your brand's own channels. Earned mentions are posts from creators, consumers, and press mentioning your brand organically. For CPG advertising teams, the earned percentage is the clearest signal of influencer program effectiveness.
A brand with 70% owned mentions is essentially talking to itself. A brand with 60% earned mentions has built a creator and consumer ecosystem that amplifies its message beyond paid placements. Growing the earned percentage while maintaining or growing total SOV is the goal of a well-run food CPG influencer program.
4. Platform Breakdown
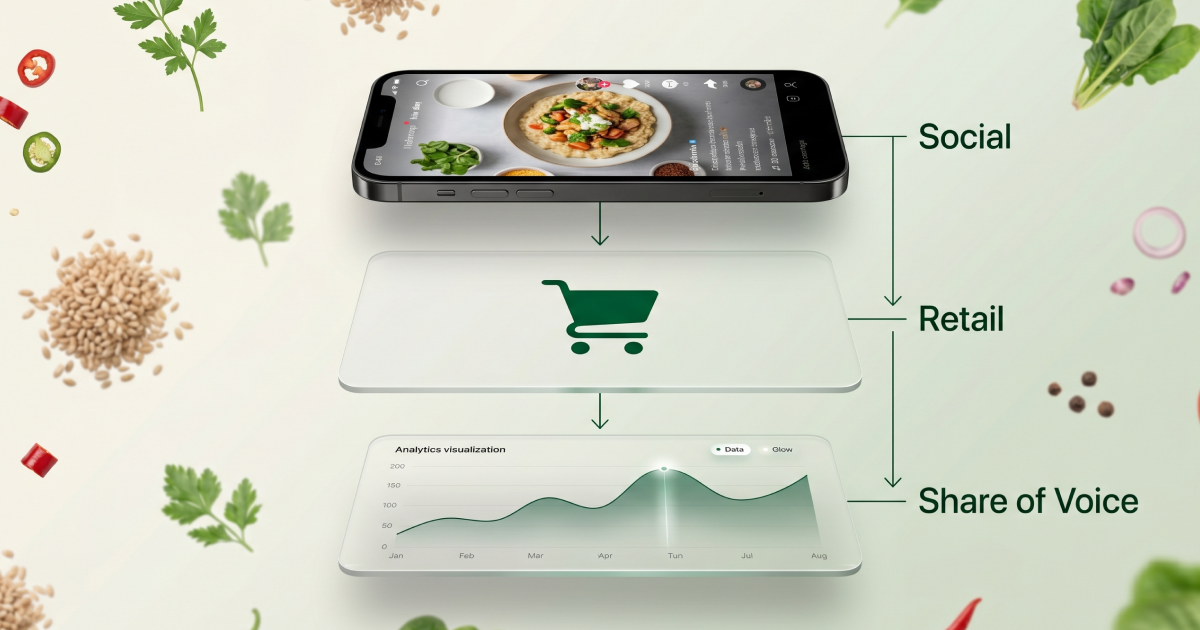
Where the category conversation concentrates matters for budget allocation. Jupiter's live data across 38 CPG categories shows 47.7% of mentions on Instagram and 42.9% on TikTok. But this varies by category. A snack brand skews more heavily toward TikTok; a specialty oil brand often dominates on Instagram. Platform breakdown SOV tells you which channel your competitors are winning and where you have room to grow.
See Your SOV vs. Competitors Before Your Next Campaign
Jupiter automatically configures your competitive tracking set the moment you add your brand. No spreadsheets, no manual setup. Your SOV dashboard is live within 24 hours.
Why Quarterly SOV Reports Are Not Enough
Most CPG brands that track share of voice do it quarterly, through a brand tracking study or a commissioned social listening report. By the time the data arrives, a competitor has already run the campaign that shifted the numbers.
The gap between quarterly SOV reports and the pace of creator content is one of the most consequential lags in CPG advertising. A competitor can launch a TikTok creator campaign, generate 4 million impressions, and pull three percentage points of SOV in the time it takes your brand tracking study to field.
Weekly SOV collection solves this. Detecting a competitor surge in week two of their campaign gives your team enough time to respond: pull budget from lower-priority channels, brief an additional creator cohort, or accelerate a planned campaign launch. Detecting it three months later does not.
The platform breakdown data compounds this. If a competitor is gaining SOV almost entirely on TikTok while you hold strong on Instagram, that is a specific, actionable gap. You know which platform needs creator investment, and you can move on it in days rather than quarters.
Connecting SOV to Influencer Campaign Performance
Share of voice becomes most powerful for CPG brands when it connects directly to campaign execution data. That connection is what separates a monitoring tool from a decision-making tool.
The metric that makes this connection is the owned-to-earned multiplier. If your brand's influencer campaigns generate 10 owned posts per quarter and those 10 posts produce 85 earned creator and consumer mentions, your earned multiplier is 8.5x. That number tells you the organic amplification your paid influencer investment is generating in the category conversation.
Growing earned SOV through creator campaigns is also the highest-leverage CPG advertising strategy for brands without the media budgets of a Kraft or a General Mills. A well-run creator program with 20 to 30 micro and mid-tier food creators can generate enough earned mention volume to shift SOV meaningfully in a focused category. The pasture-raised eggs space is a working example: brands like Pete & Gerry's and Nellie's Free Range built category SOV against Eggland's Best not through paid media scale but through sustained creator program investment on Instagram and TikTok.
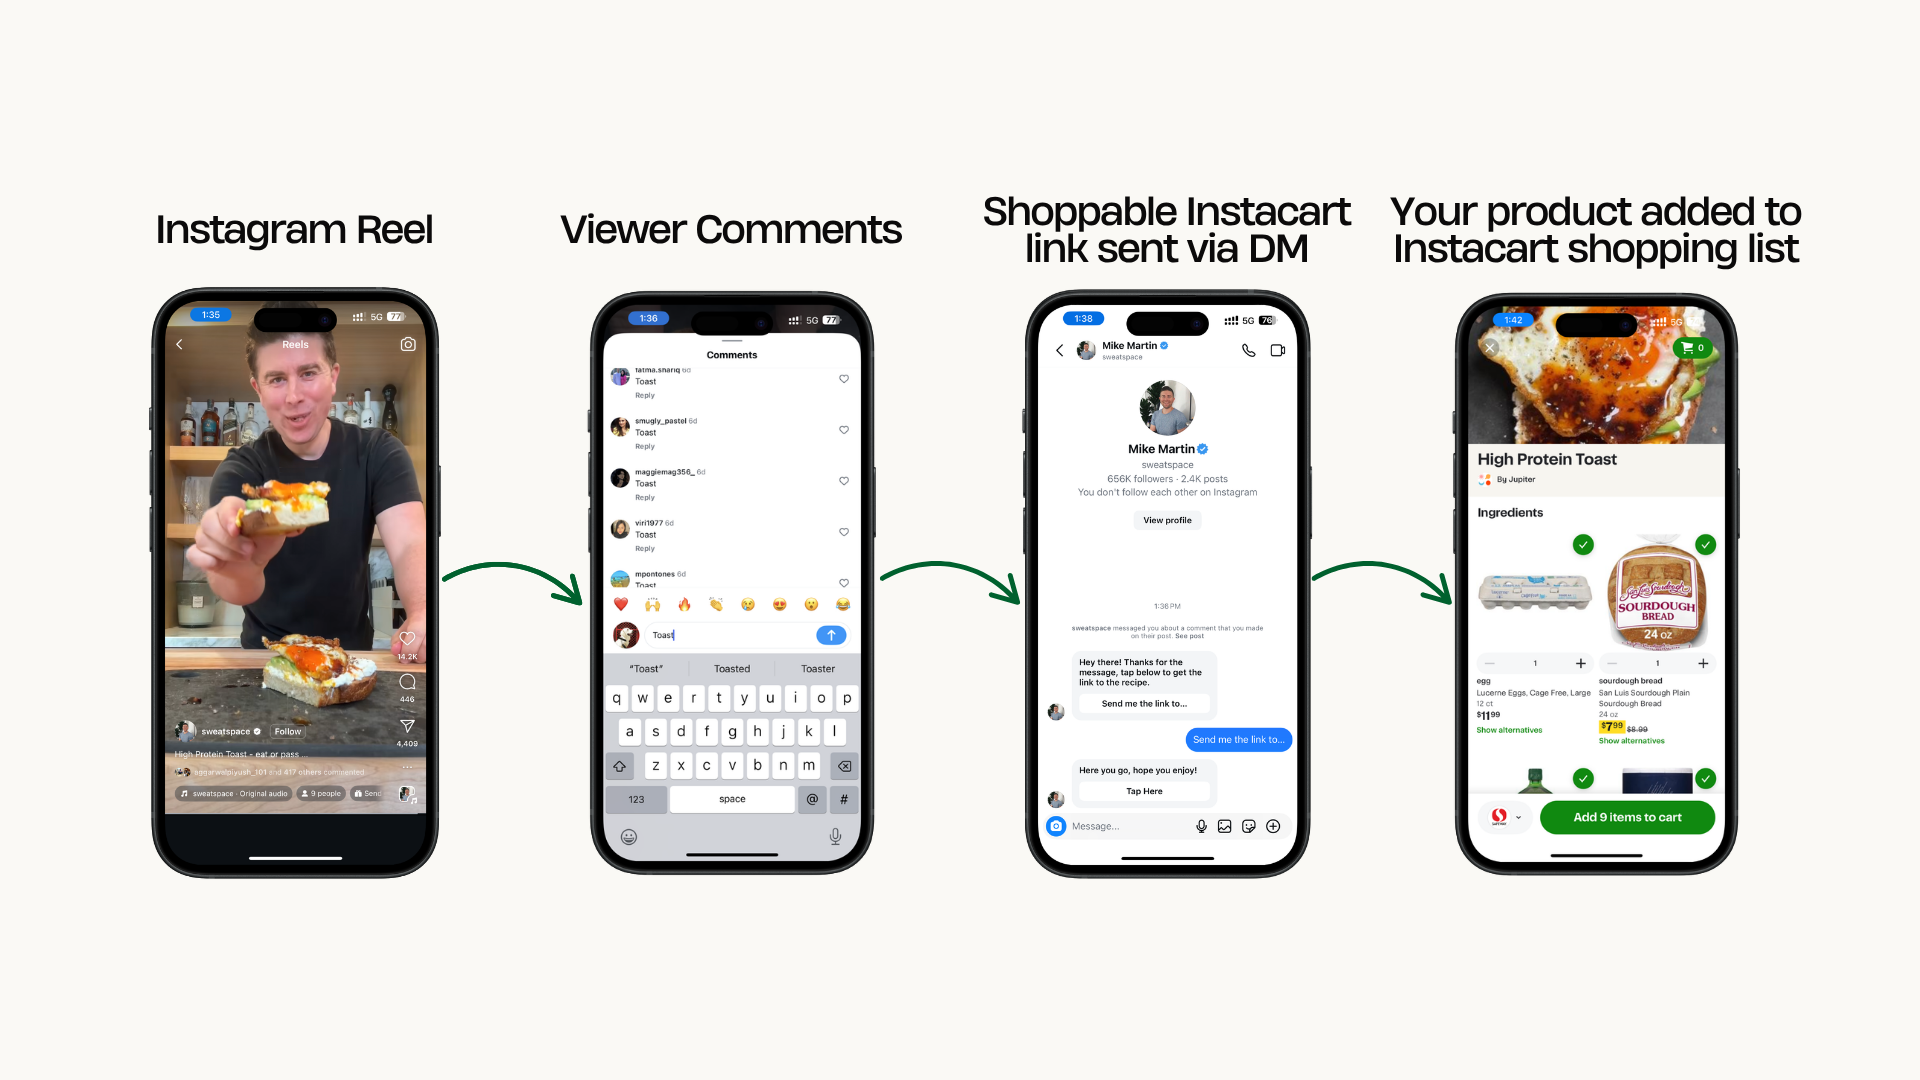
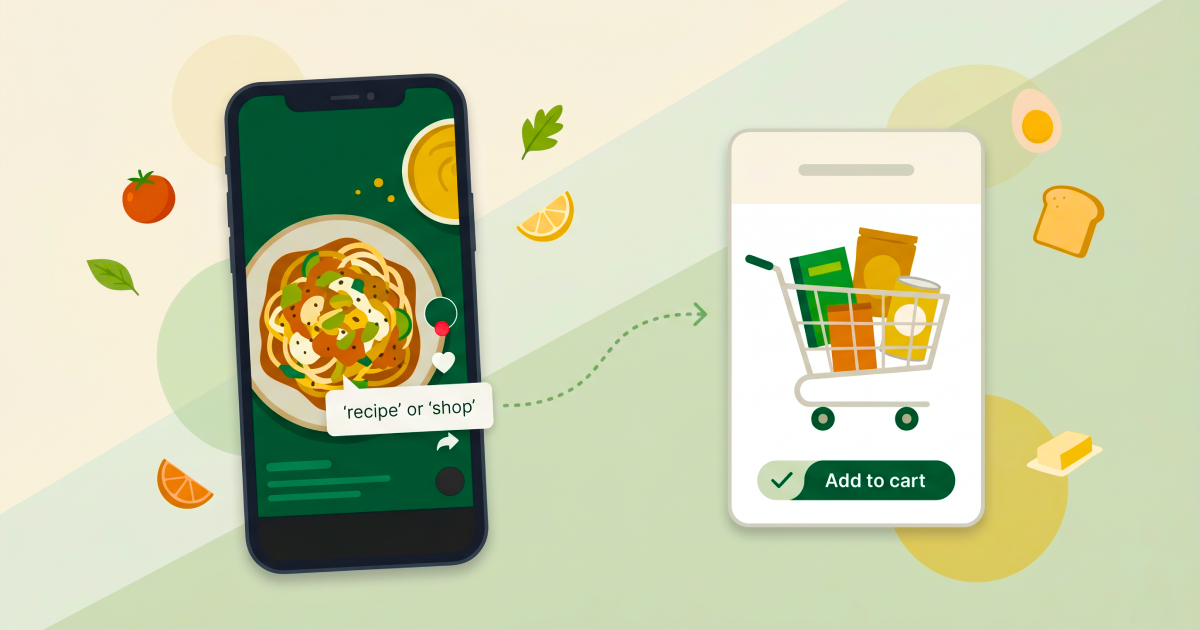
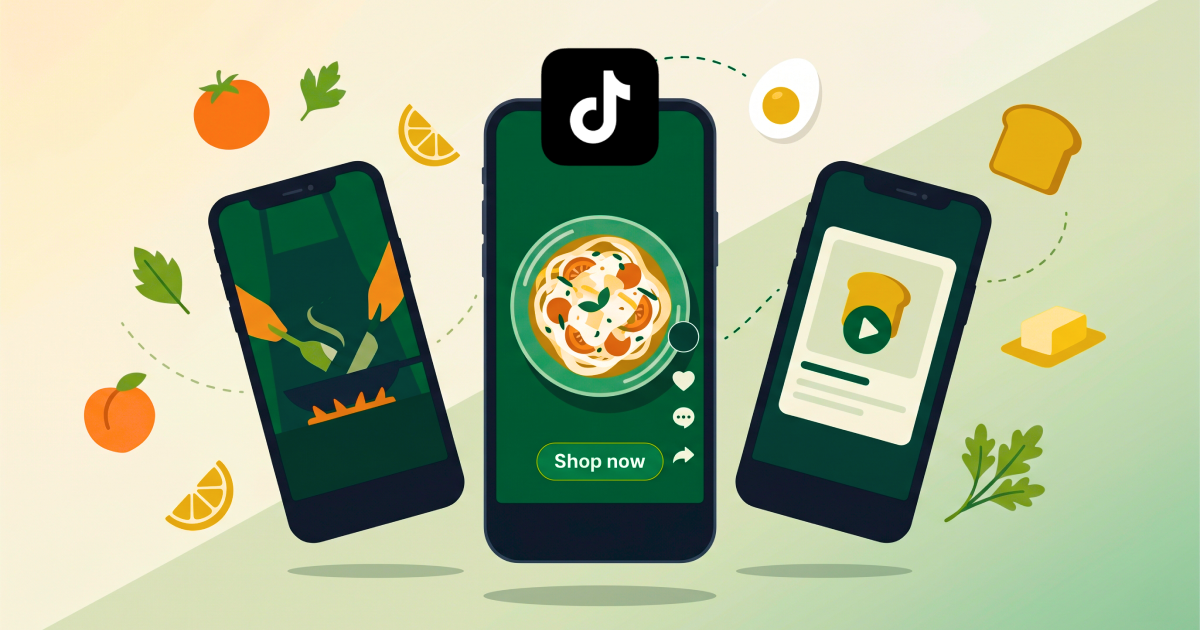
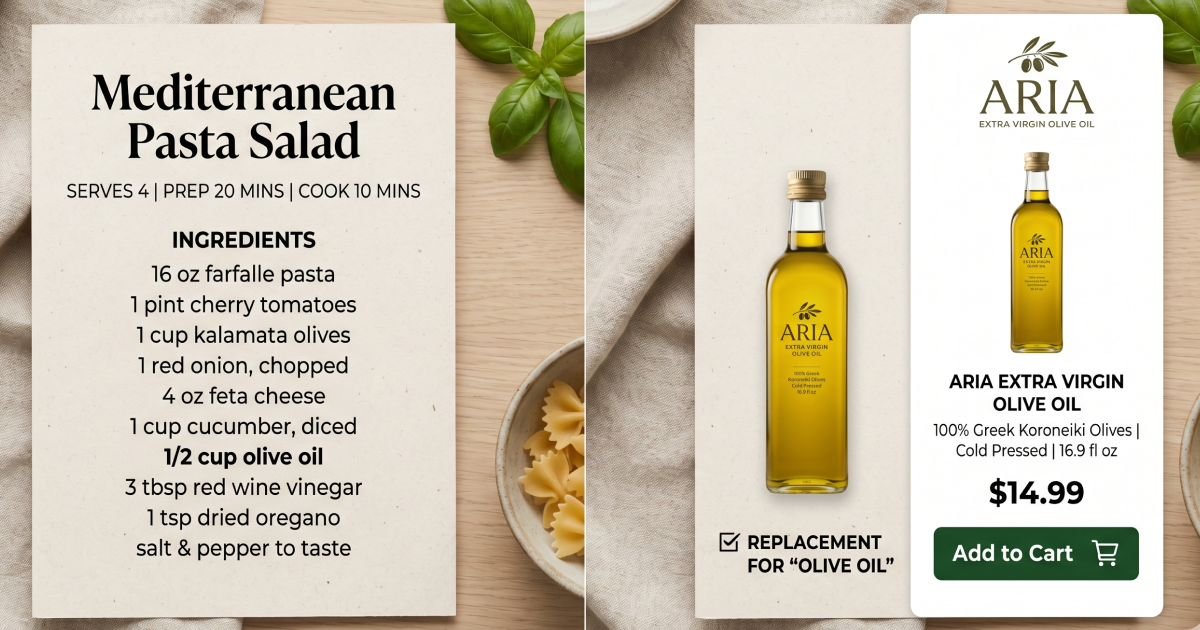
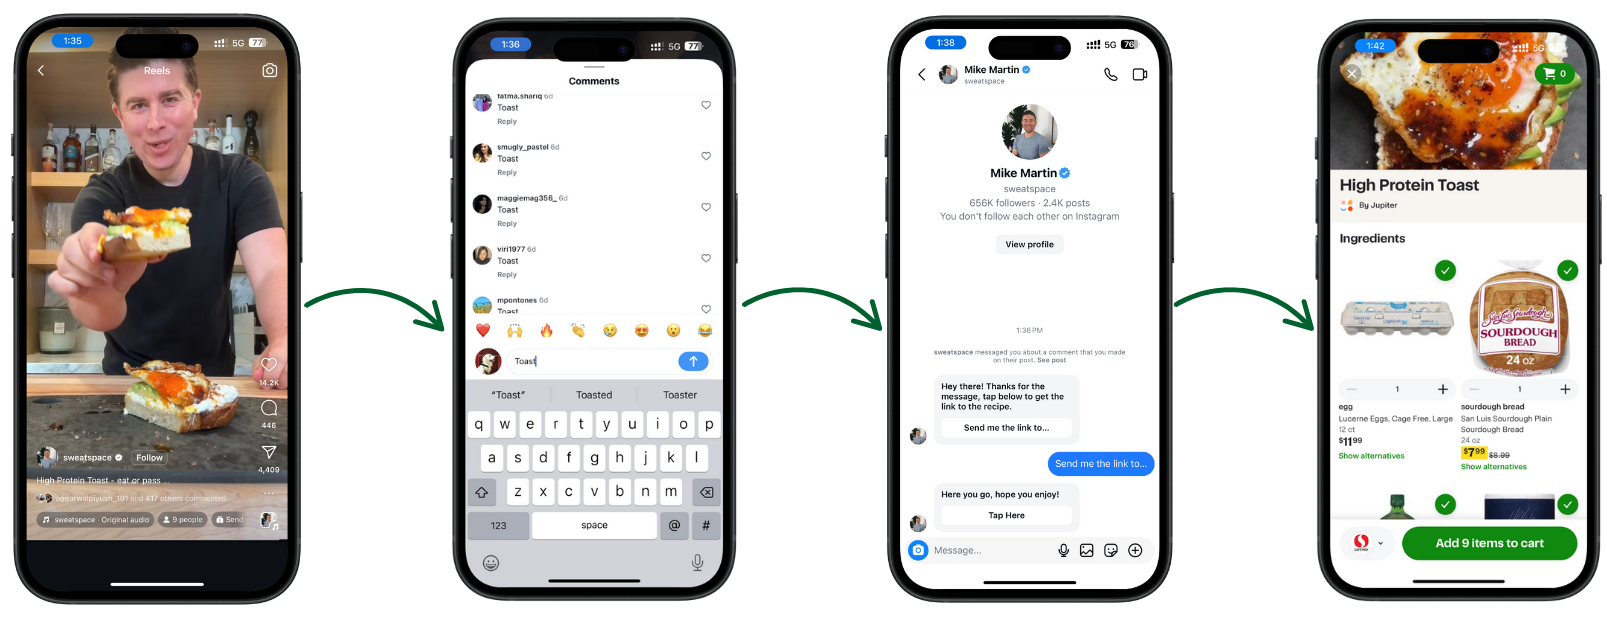
For food brands selling on Instacart, SOV tracks alongside a second critical metric: Instacart cart adds attributed to specific creator posts. Jupiter's comment-to-cart mechanic lets viewers comment on a creator's recipe post with a specific keyword and automatically receive a DM with a shoppable Instacart link tied to that creator and post. One Instagram Reel using this mechanic generated 6.5 million views and over 1,000 Instacart cart adds. SOV tells you who is winning the conversation; Instacart attribution tells you who is converting it.\
Running CPG Campaigns Without Knowing Your Share of Voice?
If you're measuring impressions but not competitive position, you're missing half the picture. Jupiter's SOV dashboard shows your standing in the category conversation from day one.
Four Decisions SOV Data Makes Easier
Knowing your share of voice number is only useful if it drives specific decisions. These are the four that CPG marketing teams use SOV data to make with confidence.
Budget reallocation between platforms
If Instagram holds 73% of your category's impression volume but a competitor is rapidly growing their TikTok SOV, that is a leading indicator of where the category conversation is shifting. Moving creator budget toward TikTok before the shift is complete is a defensible position that SOV data supports.
Identifying competitive surges before they become problems
A competitor jumping from 18% to 27% SOV in a 30-day window is running something. It might be a creator seeding campaign, a major influencer partnership, or a viral organic post. Knowing it happened, and knowing which platform it happened on, lets your team investigate and respond rather than discover it when the quarterly report lands.
Benchmarking influencer investment
For CPG brands making the case internally for creator program budget, SOV movement is a cleaner metric than raw impressions. Showing that a $50,000 creator program increased earned SOV from 12% to 19% in a category with five tracked competitors is a more compelling budget justification than showing impression totals that the finance team cannot contextualize.
Finding platform-specific gaps
When your SOV is strong on Instagram but weak on TikTok relative to the same competitors, that is a specific content and creator brief gap, not a general awareness problem. SOV by platform turns a vague "we need to do more TikTok" conversation into a data-backed investment decision.
How Jupiter Handles SOV Tracking for Food CPG Brands
Jupiter's share of voice tracking is purpose-built for grocery CPG categories. It does not require brands to configure tracking terms manually, commission a monthly listening report, or export data into a separate analytics tool.
When a brand is added to Jupiter, the platform automatically identifies the grocery category, discovers four to six direct competitors, and configures the full tracking setup: keywords, hashtags, and social handles per platform. The competitive intelligence dashboard is live within 24 hours with no setup work from the marketing team.
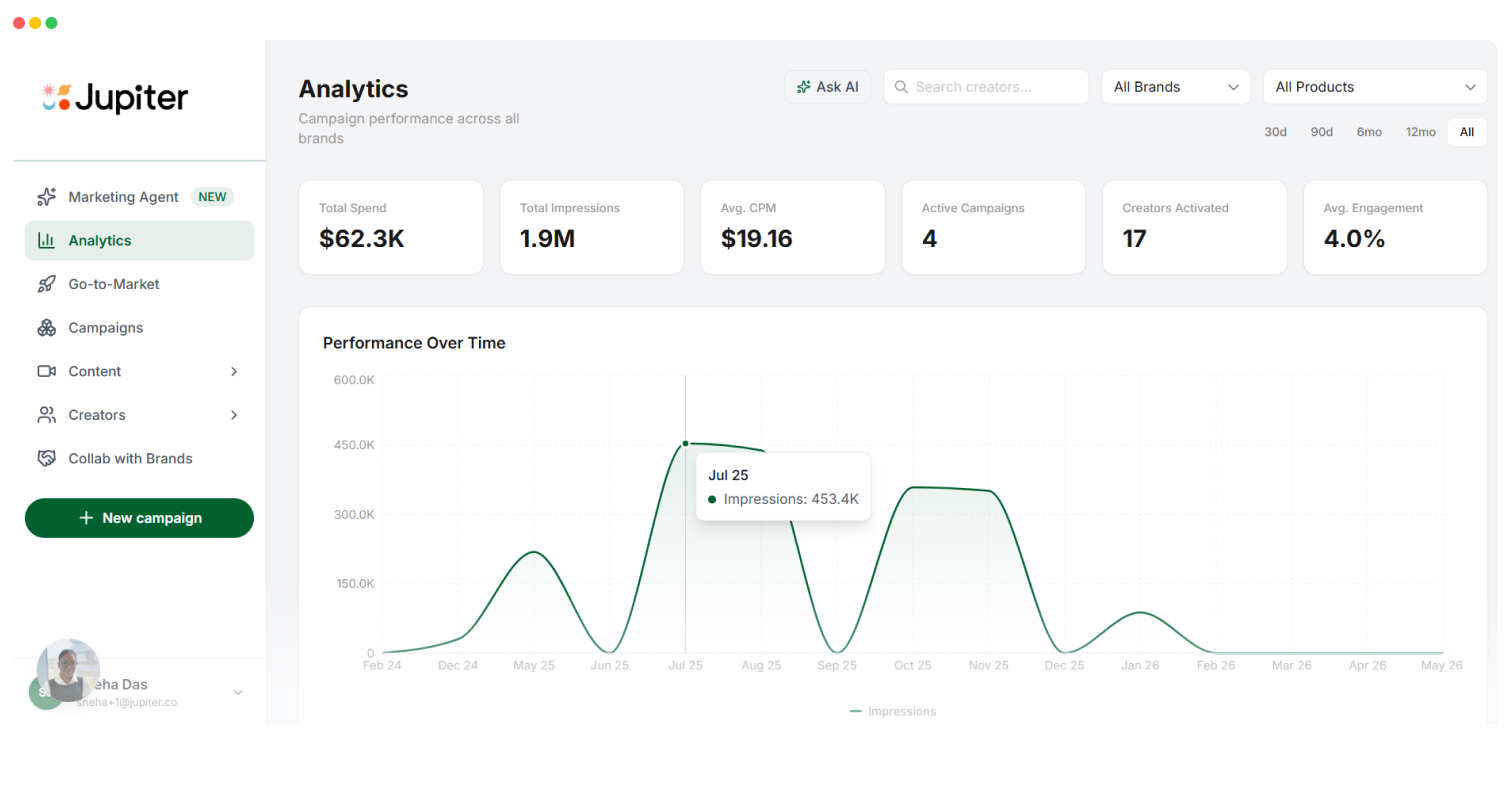
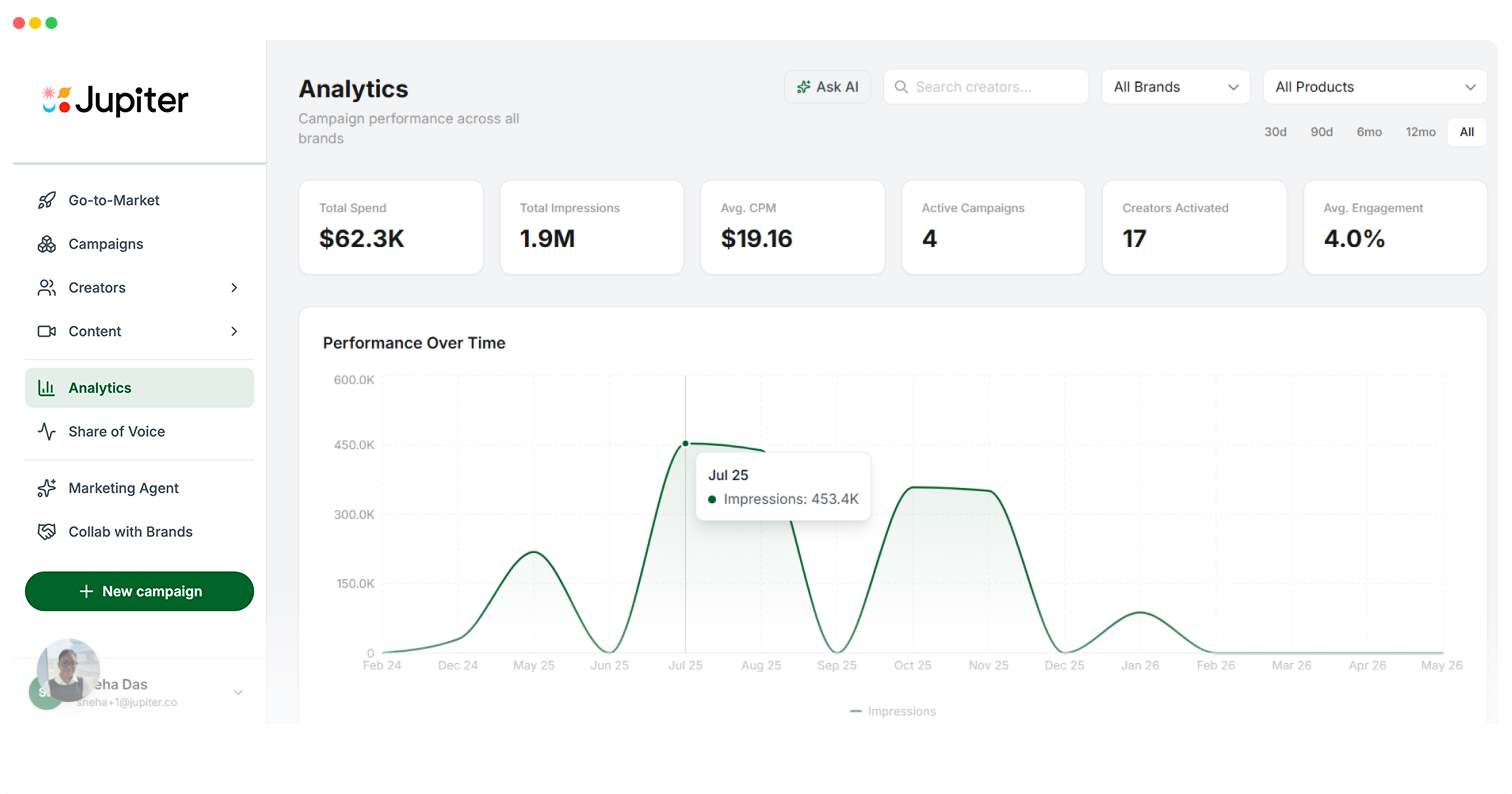
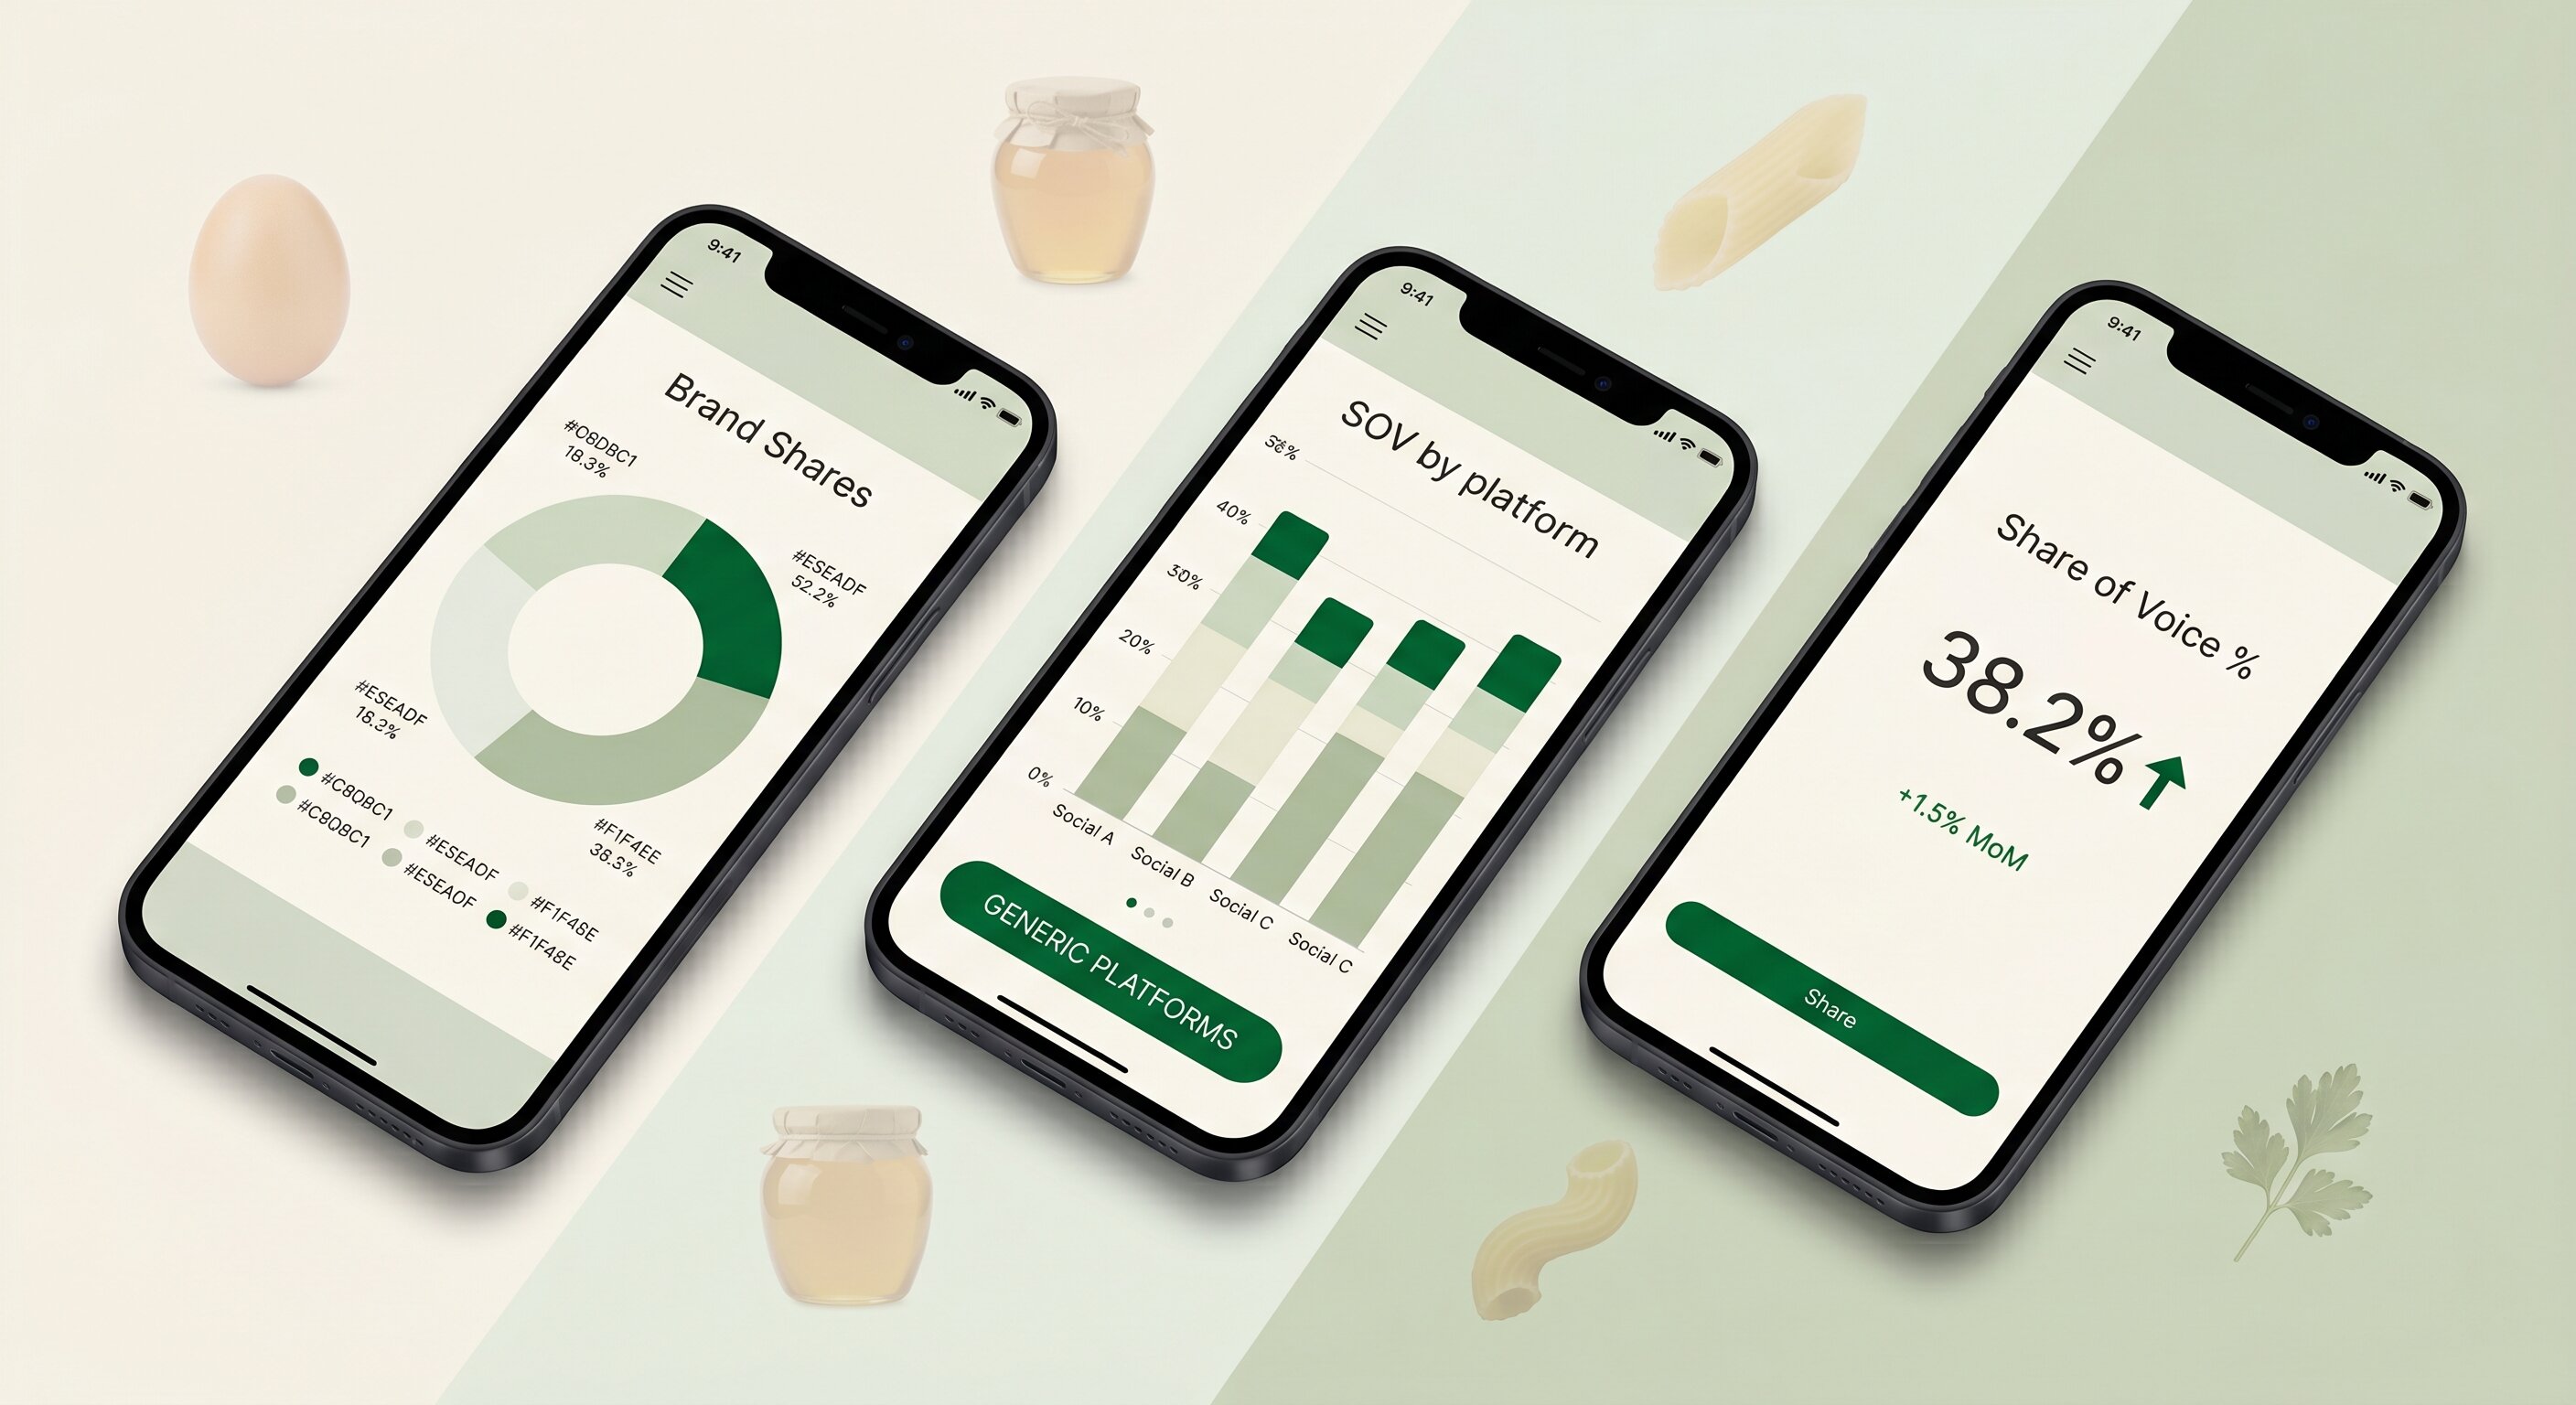
The dashboard surfaces five KPI cards: your SOV percentage and period-over-period delta, total category mentions, your mention count, your owned percentage, and your engagement SOV. Below the KPIs, a mention trend chart shows daily volume by brand over 7, 30, or 90 days with your brand's line weighted for visibility. A platform breakdown chart shows where the category conversation concentrates across Instagram, TikTok, YouTube, and X. The owned vs. earned donut chart quantifies how much of your brand's conversation you generated directly versus how much came from creators and consumers.
Across 38 CPG categories now running in production, which include everything from eggs to honey to pasta to seasonings, the system tracks 227 brands and has ingested over 9,000 social mentions. The competitive sets reflect real grocery retail dynamics because the AI derives them from how brands actually compete at shelf, not from how the brand self-identifies.
The same platform that tracks your share of voice also runs your creator campaigns, manages content review, tracks Instacart cart adds, and measures estimated versus actual campaign impressions. That integration is what makes SOV data actionable rather than informational. A drop in earned SOV can be answered with a creator campaign brief, built and launched from the same platform, without exporting data or switching tools.
Used by 58+ leading CPG brands including Banza, Pete & Gerry's, and Kettle & Fire, Jupiter connects influencer campaign management directly to competitive intelligence. The influencer marketing analytics dashboard shows estimated versus actual impressions at the campaign level; the SOV dashboard shows what those impressions mean at the category level.
For CPG brands that have been operating with quarterly brand tracking studies and disconnected social listening tools, the shift to integrated weekly SOV monitoring changes how fast the marketing team can move. The data is not a report. It is a live view of the competitive landscape, updated continuously, actionable the same week it arrives.
Jupiter Tracks Your SOV vs. Competitors Automatically From Day One
Add your brand, and Jupiter configures your full competitive set within 24 hours. Used by 58+ food CPG brands including Banza, Pete & Gerry's, and Kettle & Fire.
FAQs
Quick answers to common questions.
What is share of voice in CPG advertising?▼
Share of voice (SOV) in CPG advertising is the percentage of total social mentions or impressions in a product category that belong to a specific brand, measured relative to all direct competitors in that category. A food brand with 1,200 mentions in a category generating 5,000 total mentions holds 24% SOV. The metric is used to track competitive position over time, not just absolute reach.
How do CPG brands calculate share of voice on social media?▼
The core formula is: SOV % = (Brand Mentions / Total Category Mentions) × 100. CPG brands track this alongside engagement SOV (brand engagement divided by total category engagement), which accounts for the quality and interaction rate of content, not just volume. Most food brands track SOV at 7-day, 30-day, and 90-day windows to separate campaign-level surges from structural share shifts.
What is the difference between owned and earned share of voice for CPG brands?▼
Owned SOV represents mentions from the brand's own channels: its Instagram, TikTok, YouTube, and X accounts. Earned SOV represents mentions generated by creators, consumers, and press organically. For CPG brands running influencer programs, growing earned SOV is the primary goal. A high owned percentage (70%+) typically indicates a brand talking to itself; a high earned percentage reflects genuine category conversation being driven by others.
How often should CPG brands track share of voice?▼
Weekly tracking is the minimum useful cadence for food and beverage CPG brands running active creator programs. Quarterly SOV reports are too slow: a competitor can shift three to five percentage points of category SOV within a single creator campaign cycle before a quarterly report captures it. Weekly data lets marketing teams detect competitor surges early enough to respond with budget or creator brief adjustments.
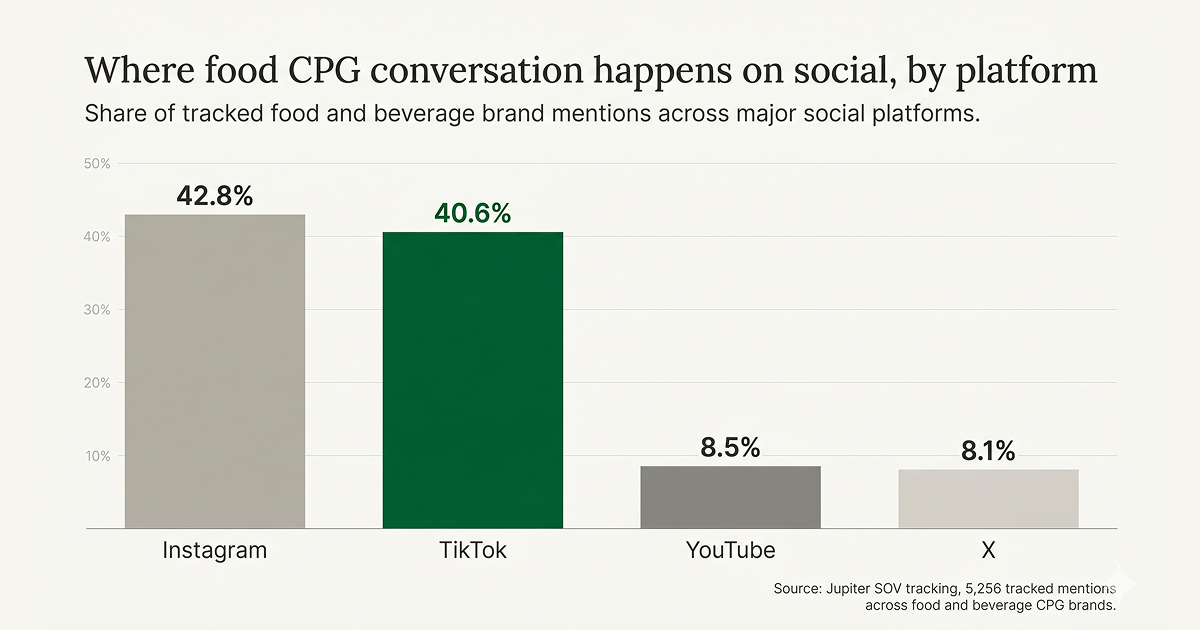
Which social platforms matter most for CPG share of voice?▼
Based on Jupiter's SOV data across 38 active CPG categories, Instagram accounts for 42.8% of the category social conversation and TikTok for 40.6%, with YouTube at 8.5% and X at 8.1%. The exact split varies by category: snack and beverage brands often skew more TikTok-heavy, while specialty and premium food brands tend to generate more conversation on Instagram. Platform-specific SOV breakdown is essential for budget allocation decisions.
Does Jupiter track share of voice automatically for CPG brands?▼
Yes. When a brand is added to Jupiter, the platform automatically identifies the grocery category, discovers four to six direct competitors, and configures full SOV tracking across Instagram, TikTok, YouTube, and X. The competitive intelligence dashboard is live within 24 hours with no manual setup required. Jupiter currently tracks 38 CPG categories and 227 brands, with data updating on a weekly collection cycle.
Related Posts
Browse more from our blog.