Influencer Marketing Metrics: 15 Definitions for CPG Brands
A glossary of 15 influencer marketing metrics for food and beverage brands, each with a one-line definition, the formula and where to read more. Includes a worked example showing how one Reel can report three different engagement rates.
Influencer marketing metrics are the numbers a brand uses to judge creator content, grouped into four stages: reach, engagement and cost, commerce, and sales. For food and beverage brands, the most useful are CPM, impressions per dollar, shop clicks, verified sales and velocity. Always write down the formula, because platforms define the same name differently.
Key takeaways
- Agree on formulas before you agree on targets. Engagement rate by followers and engagement rate by impressions can differ by a wide margin on the same post.
- CPM and impressions per dollar are the same idea from two directions. CPM is cost per 1,000 impressions, and impressions per dollar is 1,000 divided by CPM.
- Commerce metrics like shop clicks and add-to-cart rate show purchase intent, but only verified sales and velocity show what reached the shelf.
- Sales lift needs a comparison group. Without a control or a clean baseline, attributed sales can include buyers who would have purchased anyway.
- Two program health metrics, delivery rate and creator acceptance rate, catch problems before a campaign ends.
Trusted by leading CPG brands
















On this page
▼
- Influencer marketing metrics at a glance
- Reach metrics: who saw the content?
- 1. Impressions
- 2. Reach
- Engagement and cost metrics: did people care, and what did it cost?
- 3. Engagement rate
- 4. Average CPM
- 5. Impressions per dollar
- 6. Cost per engagement (CPE)
- Worked example: one Reel, three engagement rates
- Commerce metrics: did people try to buy?
- 7. Shop clicks
- 8. Click-through rate (CTR)
- 9. Add-to-cart rate
- Sales metrics: what reached the register?
- 10. Verified sales
- 11. ROAS
- 12. Sales lift
- 13. Velocity
- Program health metrics: is the campaign on track?
- 14. Delivery rate
- 15. Creator acceptance rate
- Which influencer marketing metrics should a CPG brand report?
Influencer marketing metrics only help if everyone means the same thing by them. A brand manager, an agency and a creator can all say "engagement rate" and report three different numbers for one post.
Our view: write the formula next to every metric in your brief and your report. The name matters less than the math. This glossary gives 15 metrics a food or beverage brand will actually use, each with a one-line definition, the formula and a link to a longer guide.
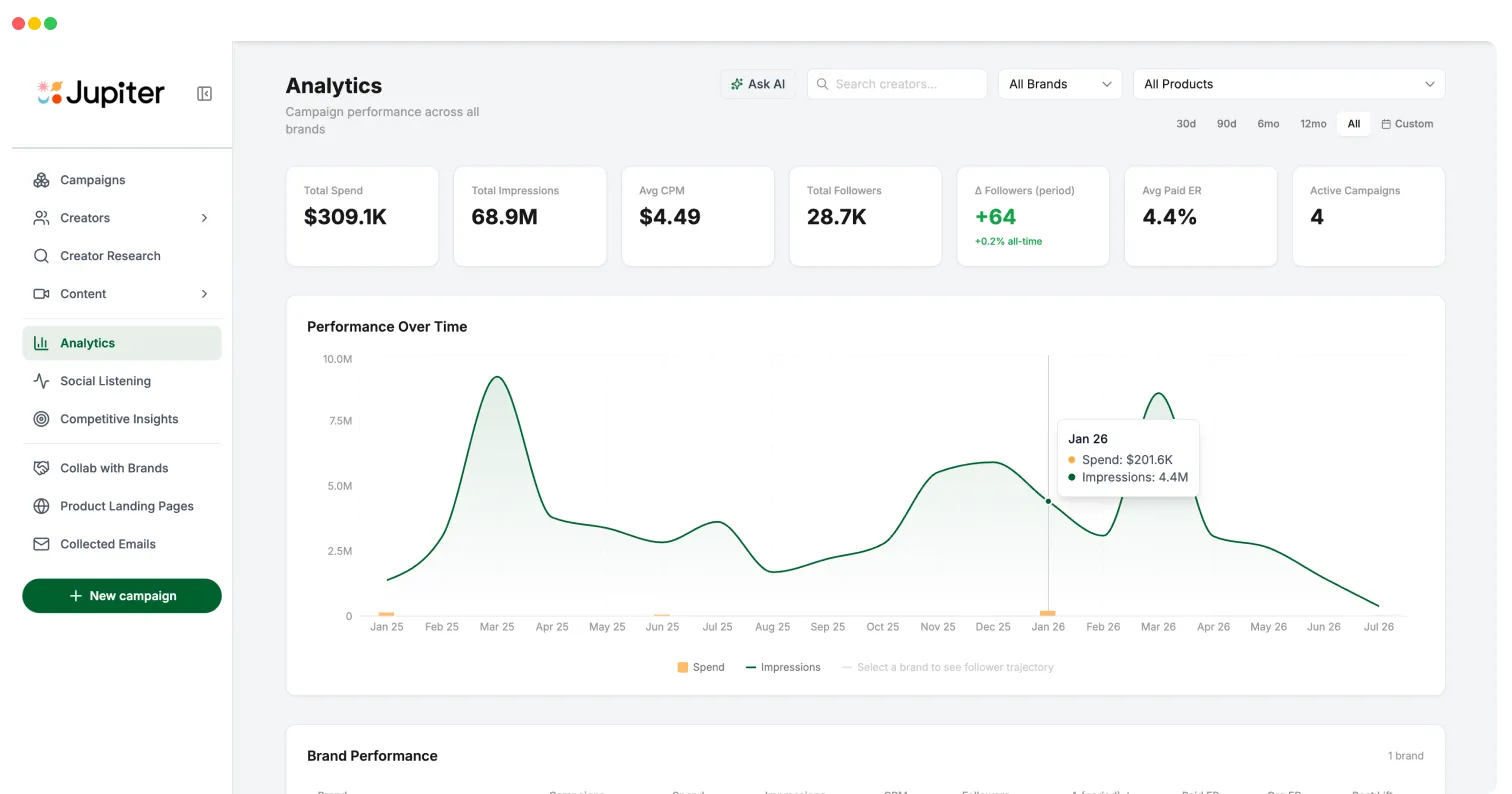
Where Jupiter's influencer marketing analytics dashboard uses a specific label, like Average CPM or impressions per dollar, we use the same label here.
Influencer marketing metrics at a glance
Metric | Formula | Question it answers |
|---|---|---|
Impressions | Count of times content was on screen | How often was it seen? |
Reach | Count of unique accounts that saw it | How many people saw it? |
Engagement rate | Engagements ÷ impressions (or ÷ followers) | Did people react? |
Average CPM | Cost ÷ impressions × 1,000 | What did attention cost? |
Impressions per dollar | Impressions ÷ cost | How far did each dollar go? |
Cost per engagement | Cost ÷ engagements | What did a reaction cost? |
Shop clicks | Count of clicks to a product or retailer page | Did people try to buy? |
Click-through rate | Clicks ÷ impressions | How well did content drive clicks? |
Add-to-cart rate | Add-to-carts ÷ shop clicks | Did clicks turn into carts? |
Verified sales | Sales matched to a purchase record | What did people buy? |
ROAS | Attributed revenue ÷ cost | What came back per dollar? |
Sales lift | (Test sales minus control sales) ÷ control sales | What did the campaign cause? |
Velocity | Units sold ÷ stores selling ÷ weeks | Is the product moving on shelf? |
Delivery rate | Actual impressions ÷ estimated impressions | Is the campaign on track? |
Creator acceptance rate | Accepted offers ÷ offers sent | Is the offer attractive? |
Reach metrics: who saw the content?
1. Impressions
Impressions are the number of times a piece of content appeared on screen, including repeat views by the same person.
Formula: impressions = total on-screen appearances, as reported by the platform.
Meta's impressions definition counts an ad each time it comes on screen for the first time in a view, and two views in a day count as two. Creator organic posts follow the platform's own counting, so note the source in your report.
2. Reach
Reach is the number of unique accounts that saw the content at least once.
Formula: reach = unique accounts exposed. Frequency, if you need it, is impressions ÷ reach.
Meta notes that reach is an estimate built from sampled data. Treat it as directional and use impressions for cost math.
Engagement and cost metrics: did people care, and what did it cost?
3. Engagement rate
Engagement rate is the share of viewers, or followers, who liked, commented, shared or saved a post.
Formula: engagement rate = (likes + comments + shares + saves) ÷ impressions × 100. Some teams divide by followers instead.
Pick one denominator and keep it. Jupiter's creator network averages 4.4% engagement. Saves deserve extra weight on recipe content, because a save is a plan to cook.
4. Average CPM
Average CPM is the blended cost of 1,000 impressions across all creator posts in a period.
Formula: CPM = total creator cost ÷ total impressions × 1,000.
On food CPG campaigns at Jupiter, CPMs have ranged from $1.25 to $12.67. For when CPM is the right buying unit and when CPC is, see CPC vs CPM for food brands.
5. Impressions per dollar
Impressions per dollar is how many impressions each dollar of creator spend bought.
Formula: impressions per dollar = impressions ÷ cost, which is the same as 1,000 ÷ CPM.
It is CPM turned upside down, and easier to rank creators by because bigger is better. Jupiter's creator leaderboard shows it as a column next to engagement rate.
6. Cost per engagement (CPE)
Cost per engagement is what the brand paid for each like, comment, share or save.
Formula: CPE = total cost ÷ total engagements.
CPE rewards content people react to, which matters for recipe content that gets saved and cooked later. The full CPE guide goes further on which costs to include.
Worked example: one Reel, three engagement rates
Here is why the formula has to sit next to the number. The figures below are an illustrative example, not a real campaign.
A creator with 50,000 followers posts a recipe Reel for a $400 fee. It gets 30,000 impressions and 1,500 engagements, including 600 saves.
Metric | Math | Result |
|---|---|---|
Engagement rate by followers | 1,500 ÷ 50,000 | 3.0% |
Engagement rate by impressions | 1,500 ÷ 30,000 | 5.0% |
Save rate by impressions | 600 ÷ 30,000 | 2.0% |
Average CPM | $400 ÷ 30,000 × 1,000 | $13.33 |
Impressions per dollar | 30,000 ÷ $400 | 75 |
Cost per engagement | $400 ÷ 1,500 | $0.27 |
The same post reports 3% or 5% depending on the denominator. If one agency uses followers and another uses impressions, the second looks better without being better.

See every metric with the formula behind it
Jupiter's analytics dashboard tracks Average CPM, impressions per dollar and engagement rate across every creator, product and campaign.
Commerce metrics: did people try to buy?
7. Shop clicks
Shop clicks are clicks from creator content to a product page, a retailer listing or a shoppable recipe.
Formula: shop clicks = count of tracked clicks to a purchase destination.
Shop clicks show intent, not purchases. Our breakdown of shop clicks vs add-to-cart explains where each one breaks.
8. Click-through rate (CTR)
Click-through rate is the share of impressions that produced a click.
Formula: CTR = clicks ÷ impressions × 100.
A low CTR on a high-engagement post usually means the call to action or the link placement is weak, not the content.
9. Add-to-cart rate
Add-to-cart rate is the share of shop clicks that put the product in a grocery cart.
Formula: add-to-cart rate = add-to-carts ÷ shop clicks × 100.
In our experience this is where a shoppable recipe beats a plain product link, because the shopper lands on a cart that already has the ingredients. More on click behavior in our post on creator storefront shop clicks.
Sales metrics: what reached the register?
10. Verified sales
Verified sales are purchases matched to a real transaction record from the retailer or grocery platform, not modeled from clicks.
Formula: verified sales = sum of matched purchase value attributed to the creator content.
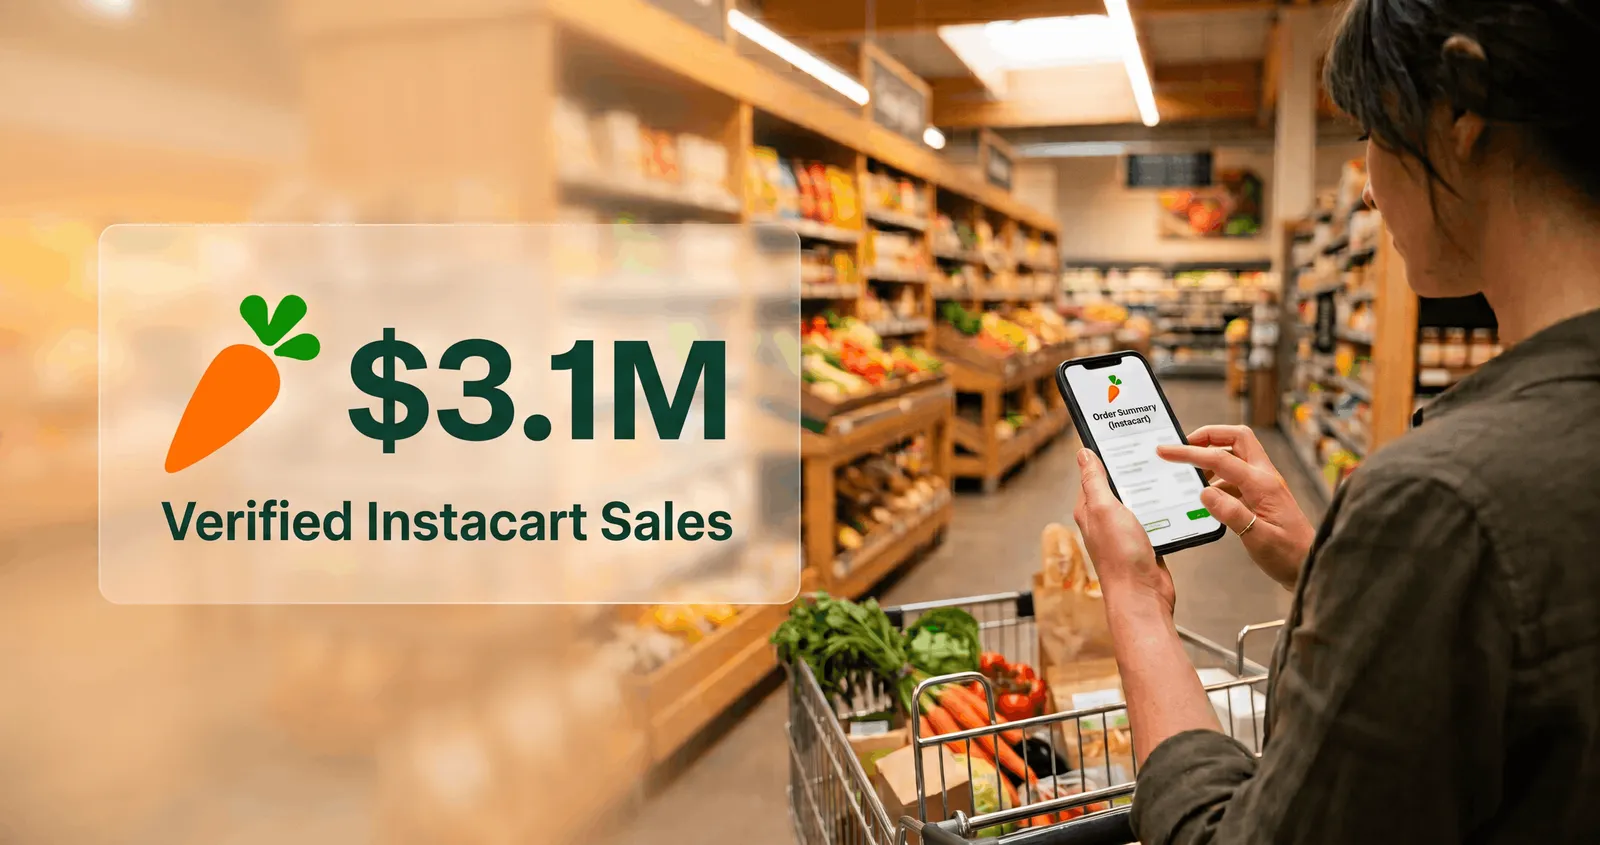
Jupiter campaigns have driven $3.1M in Instacart-verified grocery sales. Read how verified Instacart sales work for what the match does and does not include.
11. ROAS
Return on ad spend is the revenue attributed to a campaign for each dollar spent on it.
Formula: ROAS = attributed revenue ÷ campaign cost.
ROAS is only as good as the attribution behind it. Our guide to measuring influencer marketing ROI covers which attribution to trust.
12. Sales lift
Sales lift is the extra sales a campaign caused, compared with a group or period that did not see it.
Formula: lift = (test group sales minus control group sales) ÷ control group sales × 100.
Meta's Conversion Lift method works this way, with a test group that can see ads and a control group that cannot. For creator campaigns, see our campaign lift vs baseline framework.
13. Velocity
Velocity is how many units a product sells per store per week where it is stocked.
Formula: velocity = units sold ÷ stores selling ÷ weeks.
Retail buyers watch velocity more than any social metric. Our guide to SPINS data for creator campaigns shows how to read it around a campaign window.
Program health metrics: is the campaign on track?
14. Delivery rate
Delivery rate compares the impressions a campaign has delivered with the impressions it was expected to deliver.
Formula: delivery rate = actual impressions ÷ estimated impressions × 100.
Jupiter's campaign health view shows estimated vs actual impressions as a progress bar, so a campaign running behind gets flagged before the window closes.
15. Creator acceptance rate
Creator acceptance rate is the share of creator offers that were accepted.
Formula: acceptance rate = offers accepted ÷ offers sent × 100.
A low rate usually means the fee, the timeline or the brief is off. Jupiter's creator outreach funnel tracks this step by step, from requests sent to posts delivered.
Which influencer marketing metrics should a CPG brand report?
Report one metric per stage: Average CPM for reach, engagement rate by impressions for content, shop clicks for intent and verified sales or velocity for results. Four numbers, same formulas every month.
Everything else in this glossary is diagnostic. Use it to explain a change in those four, not to fill a slide. For the full program view, start with our influencer marketing for CPG brands guide.
Book a demo of Influencer Marketing Analytics
One dashboard for spend, impressions, CPM, engagement and Instacart-verified sales, filterable by brand, product and creator.
FAQs
Quick answers to common questions.
What are the most important influencer marketing metrics for food brands?▼
Average CPM, engagement rate, shop clicks and verified sales or velocity. Those four cover reach, content quality, purchase intent and actual sales. The rest explain changes in those four.
How do you calculate engagement rate for influencer marketing?▼
Add likes, comments, shares and saves, then divide by impressions and multiply by 100. Some teams divide by followers instead, which gives a different number, so state the denominator in every report.
What is the difference between reach and impressions?▼
Reach counts unique accounts that saw the content. Impressions count every time it appeared on screen, including repeat views. Impressions divided by reach gives frequency.
What is impressions per dollar?▼
Impressions per dollar is impressions divided by cost. It equals 1,000 divided by CPM. A $5 CPM means 200 impressions per dollar.
What is a good CPM for food influencer marketing?▼
On food CPG campaigns at Jupiter, CPMs have ranged from $1.25 to $12.67. Where you land depends on creator size, format, usage rights and season.
More in Attribution & Measurement
More from Attribution & Measurement.