What 229 Million Impressions Reveal About Food CPG Creator Marketing
Every influencer marketing benchmark report is built for fashion, beauty, or general DTC. This one is built entirely from food and beverage CPG creator campaigns, and it's the first of its kind.
Trusted by leading CPG brands










On this page
▼
- Methodology and dataset
- Where food CPG impressions actually deliver
- What food creator campaigns cost by tier
- TikTok median views by follower tier
- Where category conversation happens
- What separates a $1.25 CPM campaign from a $12.67 one
- Ambassador vs one-off campaign economics
- What we expect to change in 2027
Food and beverage CPG brands have never had a benchmark report built for them. Every major industry report, including the one influencer marketing agencies cite most often, surveys marketers across fashion, beauty, tech, and general DTC, then asks food brands to extrapolate. The purchase journey is different. The content is different. The attribution problem is different. A grocery shopper doesn't click "add to cart" from an Instagram post the way a beauty shopper does. They see a recipe video, they go to the store, or they open Instacart.
This report uses production data from real food and beverage CPG creator campaigns run on Jupiter: 229M+ total impressions delivered, 635 posted creator pieces, and 1,034 creators across 1,651 tracked social accounts on Instagram and TikTok. Every number below comes from that dataset, not a marketer survey. Where a number is a rate or a range, it is labeled as derived from campaign math, not self-reported estimates.
If you run creator campaigns for a food or beverage brand, this is the benchmark to check your program against.
Methodology and dataset
The numbers in this report are pulled directly from Jupiter's production campaign data across food and beverage CPG brands running Instagram and TikTok creator campaigns. Impressions and CPM figures come from actual delivered campaign performance, tracked through Jupiter's analytics dashboard. Platform split and creator tier data are calculated across the full creator network active during the measurement period.
This is not a survey. Marketer surveys ask people what they remember or estimate about their programs, and the numbers tend to drift toward whatever makes the respondent look good. Every figure here is what actually happened inside real campaigns, aggregated and anonymized at the brand level.
Two things this report is not. It is not a claim that these numbers apply identically to every food category, and it is not a set of numbers you should treat as a ceiling. Categories with strong recipe utility, like sauces and condiments, consistently post different economics than categories without a natural use-case hook, like sparkling water. The category breakdowns later in this report account for that.
Where food CPG impressions actually deliver
The single most useful number in this report for budget planning is the platform split. Across 635 posted creator pieces, 73.7% of impressions came from Instagram and 26.3% came from TikTok.
That split surprises marketers who assume TikTok dominates food content because it dominates the cultural conversation about food. It doesn't dominate delivered impressions for CPG brands specifically. Instagram's Reels distribution, paired with a creator base that has built long-term food and recipe audiences, outperforms TikTok on raw impression volume in this category. That doesn't mean TikTok is a weak platform. It means a budget split modeled on general creator economy benchmarks, which usually lean TikTok-heavy, will misallocate spend for a food brand.
What food creator campaigns cost by tier
CPM across food CPG creator campaigns in this dataset ranges from $1.25 to $12.67. That range comes from 8 production campaigns and should be read as a spread, not a single benchmark number. The lowest end of that range, a plant-based pasta ambassadorship campaign, delivered 70M+ impressions on a $17,500 budget. The highest end, a pasture-raised egg ambassadorship, delivered 1.26M+ impressions on a $16,000 budget.
The gap between those two campaigns is the most important lesson in this report, and it's covered in detail further down. For now, the range itself: budget a food CPG creator campaign somewhere between $1.25 and $12.67 CPM depending on category, creator tier mix, and campaign structure. Anyone quoting you a single fixed CPM for "influencer marketing" without asking about your category is quoting a number from a different industry. For how those rates get built into per-post quotes, see influencer pricing for food CPG brands.
These figures are derived from CPM math on actual production campaigns, not from a rate card or a marketer survey.

See where your program falls on the benchmark
The dashboard behind these numbers tracks estimated vs actual CPM on every campaign, in real time.
TikTok median views by follower tier
Follower count is a weak predictor of actual reach on TikTok for food creators. Median views per post, measured across 438 food creators in Jupiter's network, tell a more useful story:
Nano creators, 1K to 10K followers, post a median of 1,062 views.
Micro creators, 10K to 50K, post 2,118.
Mid-tier creators, 50K to 250K, post 9,154.
Macro creators, 250K to 1M, post 27,208.
Top-tier creators, over 1M followers, post 99,037.
Notice the jump between nano and micro is roughly double, but the jump from mid-tier to macro is roughly triple. Reach doesn't scale linearly with follower count. A campaign built entirely around macro and top-tier creators will look impressive on paper and burn budget fast, because CPM tends to rise with tier while the view multiplier isn't proportional across every jump. A campaign that leans nano and micro, especially in a category where content authenticity matters more than reach, often delivers more total impressions per dollar.
Where category conversation happens
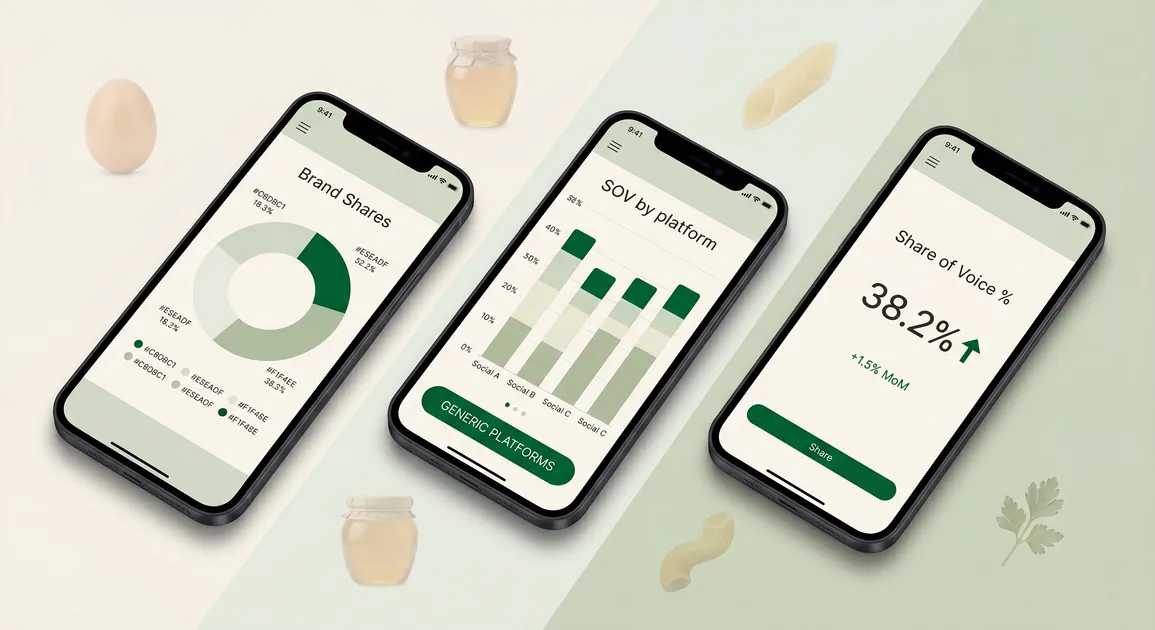
Share of voice tracking across Instagram, TikTok, YouTube, and X, based on 5,256 tracked mentions, shows the food CPG conversation splitting 42.8% Instagram, 40.6% TikTok, 8.5% YouTube, 8.1% X.
This is a different number from the impression split above, and the difference matters. Instagram and TikTok are nearly even on where the category conversation happens, but Instagram pulls far ahead on where impressions actually land for paid and gifted creator content. That gap suggests TikTok's food conversation skews more organic and less brand-initiated than Instagram's, at least inside the campaigns measured here. YouTube and X are not where food CPG brands should expect creator campaign volume, but they are not zero, and ignoring them entirely means missing roughly 16.6% of category conversation.
What separates a $1.25 CPM campaign from a $12.67 one
The plant-based pasta campaign at $1.25 CPM and the pasture-raised egg campaign at $12.67 CPM are the two ends of this dataset, and the difference between them is instructive for any brand planning a budget.
The pasta campaign ran as an ambassadorship: a longer-term structure with a consistent creator roster posting recurring recipe content. That structure builds compounding reach, because the same creators' audiences see the brand repeatedly, and the content itself functions as recipe utility content that continues getting discovered after it posts. The egg campaign, also an ambassadorship, delivered strong engagement and real Instacart conversion signal, but in a smaller, more specific category with a smaller addressable creator pool and a higher per-post cost.
Category size and recipe versatility are the two biggest CPM drivers in this dataset. A pasta brand fits into hundreds of recipe formats a creator can post about. A pasture-raised egg brand fits into fewer, and the creators who cover that category well command higher rates. Neither number is wrong. They're both accurate reflections of what it costs to reach a given audience in a given category.
Planning a 2026 budget without a category benchmark to check against?
Most food brands have been building creator budgets off fashion and beauty benchmarks that don't apply to their purchase journey.
Ambassador vs one-off campaign economics
Ambassador programs in this dataset consistently outperform one-off campaigns on cost efficiency, and the structural reason is simple. An ambassador program requires a 6-month minimum commitment and 2 posts per month per creator. That cadence means the creator's audience sees the brand repeatedly instead of once, and the brand builds a graduation pipeline, moving strong-performing creators from past one-off campaigns into longer-term ambassador roles. For the production shape of those programs, see the ambassador programs benchmark.
The plant-based pasta campaign's 70M+ impressions on a $17,500 budget is an ambassadorship. The specialty oil campaign's 13.7M+ impressions on $47,000 is also an ambassadorship. Both outperform the general awareness campaigns in this dataset on impressions per dollar, even accounting for category differences.
That doesn't mean every campaign should start as an ambassadorship. A brand testing a new product or entering a new category benefits from a general awareness campaign first, both to validate creator fit and to build the pool of creators who can graduate into an ambassador structure later. But a brand running only one-off campaigns indefinitely is paying a structural tax that ambassador programs largely avoid.
What we expect to change in 2027
Three shifts are already visible inside this dataset heading into 2027. First, retail attribution is becoming the default expectation, not a nice-to-have. Brands that could tell you impressions but not cart adds are increasingly asking for the second number, because impressions alone stopped justifying budget renewals somewhere in the last year. Second, category-specific creator rosters are consolidating. Brands are moving away from broad "food creator" targeting toward creators with proven content interest alignment in their specific category, because the fit-score data consistently shows better performance from aligned creators regardless of follower count. Third, ambassador structures are growing faster than one-off campaigns as a share of total spend, for the cost-efficiency reasons above.
None of these are predictions. They're extrapolations from where campaign structure and creator selection are already trending inside this dataset.
Used by 58+ leading CPG brands including Banza, Pete & Gerry's, and Kettle & Fire
See how the platform behind this benchmark report can run your next campaign.
FAQs
Quick answers to common questions.
What is a good CPM for food creator campaigns?▼
Food CPG creator campaign CPM in production data ranges from $1.25 to $12.67, depending heavily on category and campaign structure. Recipe-versatile categories with ambassador structures tend to land at the lower end. Niche categories with smaller creator pools tend to land higher. There is no single "good" CPM independent of category.
How does food CPG creator marketing differ from general DTC benchmarks?▼
General influencer marketing benchmarks are built primarily from fashion, beauty, and broad DTC brands, where the purchase journey often ends in a direct link click. Food CPG's purchase journey usually routes through grocery retail or a platform like Instacart, and the platform split, creator tiers, and content formats that perform differ meaningfully from those categories.
How was this data collected?▼
Every figure in this report comes from actual production campaign performance tracked through Jupiter's analytics platform, covering 229M+ impressions across 635 posted creator pieces and 1,034 creators. It is not a marketer survey.
Which creator tier delivers the best efficiency?▼
Nano and micro creators generally deliver more impressions per dollar than macro and top-tier creators, because reach doesn't scale proportionally with follower count. TikTok median views jump from 1,062 at nano tier to 99,037 at top tier, a roughly 93x increase, while pricing for top-tier creators rises well beyond that multiple in most cases.
Is Instagram or TikTok better for food brands?▼
Instagram delivers a larger share of impressions in production campaigns, 73.7% versus TikTok's 26.3%. Share of voice is closer to even, 42.8% Instagram to 40.6% TikTok, suggesting TikTok's food conversation is more organic and less driven by paid or gifted brand content.
How do I benchmark my own program against this data?▼
Compare your platform split, CPM by category, and creator tier mix against the ranges in this report. If your program is concentrated in macro or top-tier creators, or if your CPM is well outside the $1.25 to $12.67 range without a clear category reason, that's worth investigating.
More in Strategy & Guides
More from Strategy & Guides.